Market research: Definition, importance, and how to get started

Market research gives businesses a comprehensive, data-driven insight into customers, trends, competitors, and more. By conducting market research, businesses can obtain the precise data they need to enter new markets, satisfy their customers, and launch new products with confidence.
Successful business operations start with effective market research.
What is market research?
Market research is the process of collecting information on consumer behaviors, preferences, category trends, and competitive intelligence. Organizations typically conduct market research to inform product development and go-to-market strategy and ultimately drive business growth.
Market research offers businesses insight into the market, its competitors, and customers.
It helps answer questions like:
- How large is the market opportunity for my product/service?
- How does my brand stack up against the competition?
- Which demographics are most likely to buy my product or service?
- Which advertising campaign will resonate best with my target market?
This information provides a clear pathway toward satisfying customer demands, enhancing profits, and launching products.
Related reading: What is marketing research and how you can use it to win?
Why is market research important? 5 business benefits
Market research provides the necessary data-backed evidence to help your business make decisions with confidence. Instead of building a company based on gut decisions alone, market research gives you direct insight into what your audience wants to see.
Here’s why market research is so important.
1. Analyze your competitors
Every business operates in an ecosystem of partners and competitors. The more information a business has on its competitors and its audience, the more ready it is to disrupt the market. You can investigate your competitor’s success metrics, strategy gaps, and trends with market research.
Market research provides data that businesses can use to better understand its competitors’ strategies. Using this information, your company can craft high-impact campaigns to differentiate from your competitors, improve interactions, and win potential customers.
2. Comprehend what drives customer satisfaction and loyalty
Market research enables a business to collect data on its customer base, including insights into what they value about its products and services.
You can create better products and services with market research. And using data collected from customer satisfaction surveys, you can iterate upon feedback to further enhance your products, services, and customer satisfaction.
With this information, marketing and product teams won’t have to go through stages of trial-and-error to enhance their offering. Market research point teams directly to the drivers of satisfaction and loyalty.
3. Understand consumer preferences and trends through market research

Different customers have unique expectations and desires when engaging with your business.
Market research helps your company identify consumer preferences within your target audience. Market research also allows your business to identify potential gaps in the market. This will help you engineer more successful products and improve profits.
Identifying current preferences and trends enables you to create more effective marketing campaigns and better products.
4. Develop effective marketing strategies based on market research findings
Drastic changes in a company’s direction, marketing strategy, and product entail a large investment—dollars or personnel.
Market research serves as essential validation, confirming whether you can proceed or acting as a warning bell indicating the need to pivot your marketing or product strategy.
5. Market research builds credibility
Whether you’re trying to create persuasive marketing collateral, become a thought leader in your industry, or impress your C-Suite, market research arms you with the facts to back up your arguments and claims.
Market research offers the data-driven backing your teams need to make precise business decisions and demonstrate their value.
Types of market research
Market research is a broad term that encompasses several different types of information gathering.
To give you a comprehensive understanding of it, we’ll walk through each of the common types of market research, the pros and cons, and how they’re most commonly used. We’ll discuss the differences between:
- Primary research vs. secondary research
- Quantitative research vs. qualitative research
- DIY market research vs. full-service market research
Related reading: Market research defined: Types and examples
Primary research vs. secondary research
Fundamentally, market research can be broken down into two major categories: primary research and secondary research.
| Primary research | Secondary research | |
| Definition | Primary market research occurs when you collect original data that answers a specific research question. | Secondary market research occurs when you analyze existing data that others have published to answer your question. |
| Use case | Primary research is useful when a business is unlikely to find public data on the research question it has. This is especially the case when a business is investigating its own products and services. | Businesses find secondary research useful when it aims to conduct high-level research on a topic that has already undergone investigation. Wider research questions typically already have published answers. |
| Example | A business needs to find the extent to which customers find their new product visually appealing. They send out a marketing survey to capture this information. | A business wants to gain an understanding of the typical audience demographic that engages with content in the personal finance industry. Company employees find published data from personal finance institutions that hold the information they’re looking for. |
| Advantages | • Directly answers your research question. • You can control the methodology and approach. • You can ask follow-up questions to expand upon your investigation. | • Instantly access data. • Often free to access. • Can provide instant context before you conduct your own research. |
| Disadvantages | • Time-consuming to conduct. • Limited access to samples may lead to bias. • Human error may impact your results. | • Data may be out of date. • Your business doesn’t control the research, meaning there could be bias or error. • You might not have direct access to the data, instead only seeing finished data visualizations. |
Both primary and secondary market research have their unique benefits, meaning they both have a place in your research programs.
Related reading: Types and examples of primary research
Quantitative research vs. qualitative research
Quantitative research and quantitative research are two sides of the same coin. The first might uncover a figure, like the total percentage of satisfied employees in your organization, while the latter may uncover the ‘why’ behind that figure.
| Quantitative research | Qualitative research | |
| Definition | Quantitative research is market research that uses numerical data, often relying on statistical analysis to provide numerical results. | Qualitative research is market research that focuses on understanding the motivations, feelings, ideas, and options behind information. |
| Use case | Quantitative research is helpful for identifying patterns or numerical evidence that can be used to demonstrate concepts in your business. | Qualitative research is useful when you want to understand the reasons behind a statistic, expanding research to comments, ideas, and anecdotes. |
| Example | A business wants to understand its employee loyalty rates. It uses an eNPS survey to calculate the total percentage of loyal employees in the company. | A business wants to understand why employees responded to the eNPS the way they did. The company uses surveys to ask employees questions about their levels of satisfaction, problems in the workplace, and suggestions to enhance the employee experience. |
| Advantages | • Provides objective data for analysis and comparison. • Businesses can explore data sets on a granular level to reveal micro-understandings. • Provides a clear picture of the relationship between statistics. | • Uncovers the rich information behind why numerical information is the way it is. • Provides context to quantitative data. • Can identify reasons that influence data that numbers alone may not show. |
| Disadvantages | • Some things are hard to quantify. • Numbers can be misrepresented. • Misleading questions can lead to misleading results. | • It is subjective, making it hard to analyze. • Differing interpretations of sentiment can make qualitative data hard to work with. • Storing and conducting analysis on qualitative data is challenging. |
Researchers can conduct quantitative and qualitative research individually or in combination to gain broader and deeper insights.
DIY market research vs. full-service market research
Another important factor that sets forms of research apart is who conducts it.
| DIY market research | Full-service market research | |
| Definition | DIY market research is where a business conducts research by itself, making use of its own resources to conduct research. | Full-service market research is where a business contracts an external professional research group to conduct the research and present it to them. |
| Use case | DIY market research is useful for businesses that have a limited budget for research. | Full-service market research is useful when businesses need a high-quality standard of research, often analyzing complex data. |
| Example | A business leverages its email list to send out a survey over email to gather insight into its customers. | A business needs to conduct a detailed phone survey across the United States, gathering 10,000s of call records and using them to test responses to a new product design. |
| Advantages | • Low-cost way of generating information. • Complete control over the type of question you send out. • Get results faster. | • Experts in their fields will conduct your research. • Offers a high degree of accuracy, unbiased data collection, and comprehensive detail. • Access to advanced research suites, tools, and wide populations to survey. |
| Disadvantages | • Can be time-consuming to conduct your own research. • Only have access to sources that your business is already in contact with. • The expertise of your research team will impact the quality of your results. | • Can be expensive. • You have less insight into the actual research process. • Can take months to complete a project. |
Depending on your goals, desired turnaround time, and expectations from your market research, DIY vs. full-service market research may be more appropriate for your business.
How to conduct market research: Step-by-step guide
Market research is a nuanced process that requires foresight and some advanced planning. Mapping the research will equip you to successfully launch an initiative, gather insights, and convert data into actionable steps for enhancing your organization.
Here are the steps you should follow when conducting market research.
Step #1: Set research objectives
Starting a market research project from scratch can feel intimidating. To focus your research, you should lay out the business question and research goals you’re looking to achieve.
The business question is a short summary of the problem you’re solving and the context of how it fits into your business. Business questions are high-level goals or challenges that tie directly to business objectives that can help you make informed decisions.
A business question might involve:
- Knowledge gaps: Things you don’t know about your industry, competitors, or buyer persona.
- Business phenomena: Trends you’re seeing in the business (e.g.: dips in sales or increases in churn) that need explaining.
- Predictions: You might just be looking to be one step ahead of your competitors.
The research goal is an outline of the specific facts or metrics you hope to learn with your research. In other words, your research goals are what helps you answer your business question, you can map research goals to that question.
Writing strong, relevant research goals is important because they will translate to specific survey questions later on.
Examples of research goals and business questions in market research
To outline how to set effective research objectives, here are some hypothetical business questions and research goals.
| Business question | Research goal |
| Consumer behavior: We’re considering investing in a couple of video streaming services companies, and we need to understand the existing landscape and perceptions so we invest wisely. | • Learn what tech brands and apps are most popular among millennials. • Gather proof points around the quantity/satisfaction of apps used. • Understand millennials’ usage and attitudes towards streaming services. |
| Ad testing: We’re close to going to market with our new dog food, and our designers have come up with several great designs for print ads. How do we choose which design to go with? | • Compare consumer appeal and preference for each ad design. • Identify which design consumers would be willing to pay more for. • Assess any differences by consumer demographics. |
| Brand tracking: We’re an established brand in the sparkling water category, but a lot of new brands have launched in the last year. What does that mean for us? | • Measure brand awareness for all major brands in the category. • Assess each brand’s perception and associations. • Understand brand adoption for our brand and the new entrants. |
Once you’ve established a business question and research goal, you should document them in a research brief.
A well-written research brief will tell anyone who’s interested exactly what you’re studying (and what you will not be) to make sure everyone is on the same page.
If anyone wants to suggest something that’s not part of your experiment, your research brief will help you show why you need to stick to the plan.
Step #2: Identify your target audience
When you’re conducting market research, your ultimate goal is to understand the behaviors and perceptions of the target population you’re interested in.
Identifying your target audience before conducting market research ensures you gather relevant, accurate data, tailor your approach, optimize resources, and develop effective strategies.
To do that, you need to know who your target audience is. Here are some characteristics that you could use to define your target audience:
- Demographics: Location, age, gender, education, household income, race, marital status, parental status.
- Employment and firmographics: Employment status, job function, job level, industry, company size.
- Shopping habits: Stores shopped recently, online shopping frequency, restaurants visited recently, likelihood to make a purchase in the next 12 months.
- Behavioral attributes: Mobile device/app usage, pet ownership, exercise frequency, dietary restrictions, hobbies.
Now, if you’re a well-established company, you probably already have a good sense of who your target market is and the attributes that define it.
Knowing who you need to target with your market research and how you plan to do it will have implications for how you resource your project.
Try to answer the following questions before getting started:
- Who am I conducting market research on?
- How many people do I need to gather data on?
- Do I already have access to those people?
- Will I be able to get responses from the people I have access to fast enough?
- How will I send my chosen research method to these people?
With market research, there are times when you want to target a broad audience and times when you want to target a narrower group of people.
Related reading: 5 types of market segmentation and how to use them
How to reach your chosen target audience

The method you use to reach the people you need to gather data from depends on who you want to contact.
Rest assured there are a variety of options for getting in contact with the right people.
1. Leveraging existing contacts
Your existing contacts could be your friends, family, coworkers, customers, website visitors, and social followers. These are all people to whom you already have access.
In most cases, you have some way of contacting them to invite them to take your survey. Common ways of surveying existing contacts:
- Via email.
- By posting on social media.
- Embed the market research data collection on your website.
- Adding a web link or QR code on a receipt, piece of marketing collateral, etc., so people can scan it to access data collection.
2. Reaching a specific group of people
When you have a specific target market in mind, you may not directly have access to the people you need to contact. Let’s say you have a product that’s specifically for small dogs.
If you think about the US, pet owners are a subset of the adult population, dog owners are a subset of pet owners, and small dog owners are a subset of all dog owners. If you want to understand the packaging appeal of your product, it makes sense to target this relatively small population.

There are two ways of targeting a narrow population, like small dog owners.
3. Choose from pre-profiled targeting options
Tools like SurveyMonkey Audience offer businesses access to an audience of over 175 million people with advanced targeting options.
SurveyMonkey asks our audience several questions to build up persona profiles of every single member on our platform. We ask questions related to:
- Demographics: Age, gender, household income, etc.
- Firmographics: Industry, job title, job level, etc.
- Behavioral attributes: Devices used, apps downloaded, etc.
- Shopping habits: primary grocery shoppers, stores shopped at, etc.
Check out the targeting options we have available for your next market research project.
Don’t forget to double-check the balancing options. Even when you’re targeting a narrower group of people, you want to ensure the proper demographic balancing. That way, you won’t end up with only female small dog owners instead of a balance of male and female small dog owners.
4. Use custom screening questions
When the available targeting options don’t get you the exact target audience you’re looking for, you can write your own screening questions to disqualify people you don’t need.
For example, if we only had a targeting option for dog owners, but you wanted to survey small dog owners, you could use a screening question to disqualify dog owners whose dogs are over a certain weight.
When you use screening questions in your survey, you’ll need to estimate the associated qualification rate (also sometimes called incidence rate), which is the percentage of respondents who make it past your screening questions and go on to take the rest of your survey.
This will help us calculate the total number of survey invites to send so you get the total number of completed responses you ordered.
It’s important to understand how targeting options and screening questions work together. For example, you could use targeting options to specify dog owners and then use a screening question to weed out large dog owners.
That way, only small dog owners take your survey. When estimating your qualification rate in this case, it would be the percentage of dog owners (who you targeted with the targeting options) that you think own small dogs (who will qualify past your screening question).
Step #3: Choose your research method
Selecting your research method is a crucial element in designing and launching a market research effort. The type of research you choose directly influences the results, making this decision vital.
While there will likely be one or two methods that align with your project goals, it’s also useful to remember that you can focus on several research methods at once. You don’t have to double down into only one method, as each can garner valuable, distinct forms of data.
Surveys
Market research surveys are a powerful tool that allows a business to rapidly gather large quantities of data. Sending out a set of closed-ended questions helps enable statistical analysis of the responses. However, the flexibility that additional open-ended questions bring allows surveys to cover all the bases you need when launching market research.
The main advantage of using market research surveys is that they are one of the fastest ways of gathering data. Businesses can send out an email with a link to complete the survey to its customers, rapidly reaching a large pool of responses.
However, businesses should be aware of the potential for bias in its questioning when creating a survey. Be sure to write good survey questions that avoid bias and don’t lead your audience to certain answers.
Here’s how businesses can get started with surveys:
- Craft a survey: Write effective questions that use the Likert scale.
- Send out your survey: Choose a channel and deliver the content through that medium.
- Collect data: Watch as data pours in as individuals begin to respond to your survey.
Get started with market research surveys on SurveyMonkey for fast, customizable, and expertly crafted surveys.
Focus groups
Focus groups bring together a small and carefully selected group of individuals who share similar characteristics.
Focus groups excel when your business wants to gather in-depth opinions, reviews, comments, and ideas related to your market research. You could discover customer motivations or a deeper level of understanding that allows you to identify important information related to your market research.
However, it is difficult to make focus groups statistically representative. Focus groups typically have up to 10 participants who may not capture your target market’s breadth of diversity. If you rely too much on this market research method, you may expose your company to bias.
Start focus groups by following these steps:
- Select your group: Gather a research panel of individuals who are most representative of your wider target market.
- Create questions: List the core questions that you want to answer in your focus group session.
- Control the discussion: Be sure to use your structured questions and prompts to monitor the discussion and ensure it stays on track.
Related reading: Focus groups and surveys for customer and market research
Interviews
Interviews are another common form of market research method. In interviews, you host conversations with customers to gather in-depth qualitative information related to your research. The interviewer’s goal is to understand the opinions and feelings a customer has about your product, services, and more.
Interviews differ from focus groups as your company has more control over the specific points that the interview follows. In focus groups, the larger number of people could lead to generalized discussions. On the other hand, you can control the interview environment. As the interviewer, you can ask follow-up questions to understand a person’s viewpoint.
Interviews are best when you need to gather hyper-specific qualitative data. Especially if someone is unlikely to share their feelings in a group, an interview is a great research method to use.
The downside of interviews is that they are incredibly time-consuming. In the space of the 30 minutes it can take to run one interview, you could have gathered 100s of survey responses. Equally, your interviewer must have training before launching these discussions. If not, they could add layers of bias to the conversation, which could impact your results.
Follow these general steps to start the interview process:
- Select candidates: You can select candidates at random or can choose those which have given previous data that you’d like to understand more about.
- Create questions: Design your questions to address all the main points related to your market research.
- Moderate the interview: Be sure to move through your questions, but follow up on any points you’d like clarity or more depth on.
Public data
Using public data for market research is another effective way of rapidly gathering data. As this data is already available to you, it is another fast method of gathering information. Governments, leading industry figures, and public-facing entities will typically release public data regularly, either throughout the year or once per year.
Public data is useful as it provides a cost-effective, accessible, and reliable source of data for your market research. Especially when taken from government sources or notable companies, the data is normally well structured, free from bias, and accurate.
However, when working with public data, you don’t have any influence on its structure. You might be lucky and find exactly the data you need. But, in most cases, you will only have access to a similar dataset that may relate to but not answer your questions.
Start using public data by following these steps:
- Identify and verify your sources: The first step to working with public data is to find sources that are credible and up-to-date. Look for government websites, recent reports from your industry, or published data from institutions, like Statista.
- Narrow your search: It’s unlikely that you find an exact dataset that represents what you’re looking for. Instead, narrow down published data to find something as close as possible.
- Capture: Download the data, clean it (if needed), and add it to your data warehouse for further future analysis.
Competitor analysis
Another market research method you can use is competitor analysis. This form of research is where you look at your top competitors, identifying areas where their strategies may differ or align with your own. You can gather detailed information on a competitor’s services, active marketing campaigns, current pricing models, brand image, and target audience.
Competitor analysis is effective as it allows you insight into how similar companies in your industry are breaking into the market. Not only does this provide context for what is working, but it can also suggest where you could differentiate from your competitors. Competitor analysis is a vital segment of market analysis. It helps you to understand where you stand in the wider industry.
However, competitor analysis can also be misleading. While many tools can help businesses to better understand its competitors, they’re not flawless. Your company may spend lots of time and resources finding information on your competitors, considering how limited your access to data may be.
Here’s how to conduct effective competitor analysis:
- Pinpoint your key competitors: Identify your main competitors, selecting some that are close in size and others that have a larger market share.
- Analyze: Conduct research on their active marketing campaigns, pricing offerings, branding, and typical target audience.
- Benchmark: Compare your business to each of these competitors, outlining the potential strengths and weaknesses of each company’s strategy.
Related reading: How to conduct a competitive analysis with the help of surveys
Step #4: Analyze data

Market research does not stop at gathering data. Conducting data analysis involves systematically examining and interpreting data to uncover patterns, trends, and insights that inform decision-making.
Here is what you should consider before analyzing your data:
Prepare for data analysis
Before you start diving into your results, you’ll want to ensure that you’re working with a complete, clean dataset. If you do these things first, you’ll have even more confidence in the findings you deliver to your stakeholders.
- Be sure that your data is clean, with all but high-quality responses filtered out. Also, it’s important that you wait for all the results to come in before starting the analysis phase.
- If you launch a survey early in the morning on the east coast, you’ll likely get a lot of responses from the east coast before the west coast. We also know that older female demographic buckets tend to fill up before younger male demographic buckets.
- One final check before diving into data analysis should be to ensure your sample represents your target population.
If the demographics of your sample do not match those of the population, you might consider weighting your results. Weighting is an adjustment technique used after data has been collected to make sure the demographic profile of your respondents matches your population.
Weighting involves custom calculations with statistical software to fix any lopsidedness in your sample by giving more weight to underrepresented groups and less weight to overrepresented groups.
Analyze data trends over time
Collecting data over time can be immensely useful to a business. Tracking things like market trends, consumer perceptions, brand awareness, and competitive intelligence can provide valuable indicators that companies need to adapt to.
Whether that’s your first wave of a tracking survey or the first month of an always-on survey, the baseline is what you’ll be benchmarking against as you collect more data. Once you have a baseline, the next time you run your survey, you’ll be able to understand if things have changed or stayed the same.
In our sparkling water brand tracking study, we decided on quarterly waves. Here’s what the awareness results look like from the first two waves.

Here are a few things to consider when analyzing data trends over time:
- Consistency: Keep the targeting criteria, balancing and other sample specifications the same in each wave. Essentially, the only thing you do want to be different is the date the samples were collected.
- Time-Splits: If you’re working with an always-on survey, you’ll want to make sure the way you split up your time periods consistently, i.e. months, quarters, years.
- Understand statistical significance: It’s natural to see differences in results across waves in a tracker and draw immediate conclusions, but it’s critical to understand whether those differences are statistically significant before making strategic decisions.
What is statistical significance?
Statistical significance shows whether one group's answers are substantially different from another group's answers by using statistical testing.
When a difference between sample groups is statistically significant, it means you can be confident your results represent a real characteristic of the population instead of random variation in your sample.
Statistical significance is useful in market research when applied to differences between respondent groups (e.g.: male vs female) or between waves of a tracking study.
Related reading: Calculate your statistical significance
How do you tell if differences are significant?
A practical rule of thumb is to check if the change between one group and the other is outside the margin of error based on the sample size. If the change is greater than the margin of error, it’s likely a statistically significant change.
You can check your margin of error using a margin of error calculator or use the table below as a guide. As a general rule, the margin of error gets smaller as the sample gets bigger.
| Sample size | Margin of error |
| 50 | +/- 14% |
| 100 | +/- 10% |
| 150 | +/- 8% |
| 250 | +/- 6% |
| 400 | +/- 5% |
| 600 | +/- 4% |
| 1,100 | +/- 3% |
| 2,500 | +/- 2% |
Here’s an example: Let’s say you surveyed 400 people, and find that your brand awareness is 50% in Wave 1 and 53% in Wave 2. This change of +3% is within the margin of error of +/- 5%, which means we cannot conclude that brand awareness has grown between the two waves.
Example of margin of error

While statistical significance can tell you what is statistically different, it does not necessarily mean that the difference is meaningful for your business. As the interpreter, you must determine if the statistical significance is important.
Beyond using the sample size and margin of error to estimate whether results are significantly different, you can use statistical testing to know for sure. Statistical testing is commonly built right into survey software.
With SurveyMonkey, you can use stat testing with comparisons and cross-tab reports. Alternatively, you can use calculators to do your own stat testing on groups of results.
Step #5: Interpret findings
When you get your market research results, you’ll likely be looking at aggregated answers for the entire sample you collected. Looking at how individual segments of your population respond to your market research is one way to uncover insights that could be critical to your analysis.
Here are a few segments of your sample you could look into:
- Demographic segments: Gender, age groups, etc.
- Geographic segments: Countries, regions, states, etc.
- Behavioral segments: Frequent category purchasers, discount buyers, etc.
Once you know what segments could be interesting to dive into, there are two ways to approach segmenting your results for deeper insights:
- Filter your results: Filtering your data allows you to understand how a specific segment of a broader population responded to your research surveys.
- Make comparisons: The benefits of looking at individual segments within your results multiply when you compare them to other segments or to your data as a whole.
Take this example from our sparkling water brand awareness study conducted via survey. Across brands, awareness was higher for women than men. Brands like La Croix and Bubly saw larger differences by gender than brands like Schweppes.

When segmenting your data, be aware of the base sizes you end up with. If you only surveyed 300 people total, segmenting your data by US state would leave you with a handful of responses from each state (at best). This would make it much harder to draw significant conclusions from those responses.
Step #6: Report findings
Finding a clear, logical story within your data is the single best way of making an impression and catching the attention of your stakeholders.
Here are seven things to keep in mind as you craft your data story:
1. Set up your story
By now, you’ve become familiar with your research. But, not everyone you’ll present it to will be. You should set up the story to ensure stakeholders understand the context before you present your findings and recommendations. Storytelling frameworks can help you come up with an outline for your presentation.
One framework you can follow is SCQA. The framework was first introduced by Barbara Minto, The Pyramid Principle: Logic and Writing in Thinking.
The SCQA acronym stands for: Situation, Complication, Question & Answer.
- Situation: Where the business is today, what the knowns are, and any other relevant context.
- Complication: The business problem that needs solving - why you set out to do market research.
- Question: What specific questions need answering with your research, and what is your approach to answering them?
- Answer: The main insights coming out of your market research that answer your business questions, and how they point to action to solve your complication.

2. Layer in business context
If you follow the SCQA framework, this will come naturally.
When presenting your research to stakeholders, business context helps you answer the “so what?” question. You need to demonstrate why your research matters, why stakeholders should care, and how the findings/recommendations can help the business.
3. Find powerful stats
No one’s going to be overly impressed if you’re throwing up percentages in the single digits. The powerful stats are the ones that support your claim with large numbers. This is because once you exceed the 50%-mark, you’re talking about the majority.
If the data that supports your story isn’t a captivating statistic, try reframing it.
Instead of “10% of Americans would feel safe as a passenger in a self-driving car”, try “90% of Americans would not feel safe.” Note that in cases where you’re conducting a structured analysis (e.g.: building a scorecard), reframing stats won’t work.
4. Focus on the “why”
In many cases, your existing business data will describe the “what.” But, when you collect consumers' voices and opinions using market research, you can uncover the “why.”
Step back and see if your presentation answers both the “what” and “how”, as well as the “why.”
5. Keep it simple
You’ve done a lot of digging into your data, and while a lot of the findings may be interesting, they might not all be relevant to your story.
Only include the results that contribute to or add color to your story and recommendations. You can leave some data out of your presentation if it distracts your audience from taking away what matters.
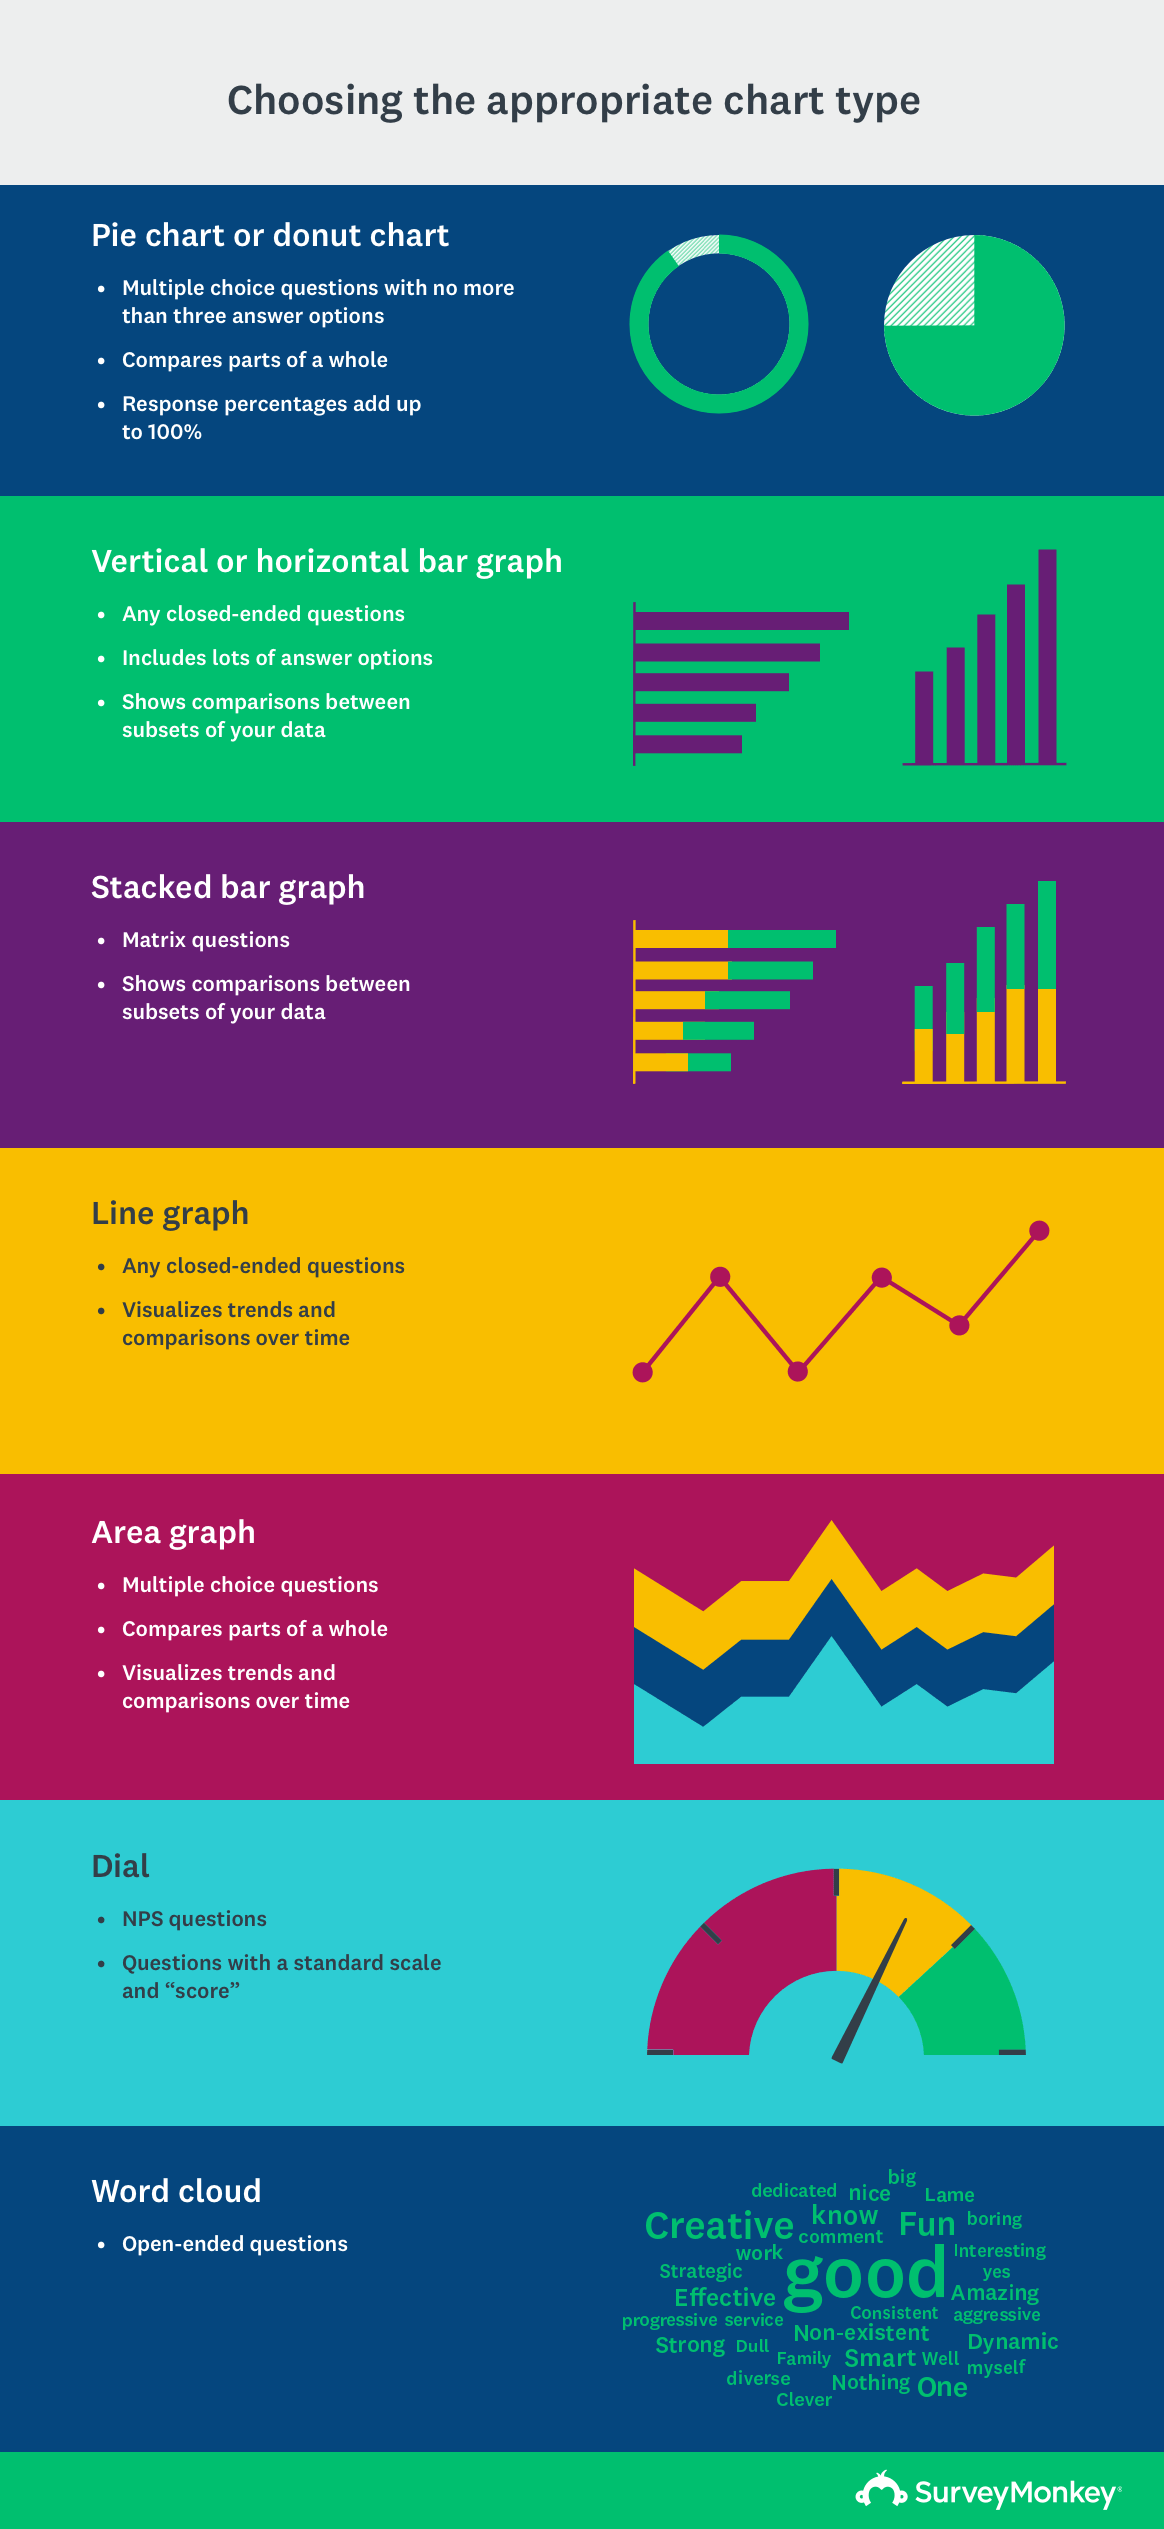
6. Choose the right visualization technique
SurveyMonkey research suggests that 42% of people found data visualized with charts, graphs, or infographics more enjoyable than data in a sentence or presented in a table.
Here are the most common chart types and when to use them:
7. Make it human
At the end of the day, the goal of market research is to explain human perceptions and behaviors. The more you can bring real examples into your story, the more tangible the results will be to your audience.
One way to do this is to pepper in quotes from your open-ended responses. You can also mix qualitative information (e.g., interviews, customer support cases, etc.) with your quantitative results. This strategy will bring your data to life and make your points that much more compelling.
Step #7: Take action
After collecting data, crunching the numbers, and drawing up an actionable plan, you’re ready to present your findings to stakeholders. Getting buy-in for your recommendations and motivating others to act can be a challenge.
The following two strategies work well when aiming to inspire stakeholders into action:
- Go on a research roadshow: Conduct a series of meetings with all major stakeholders to present your findings and recommendations. Then, find a stakeholder that’s willing to act on the next steps of your plan. Beforehand, you can present your findings to your own team and ask for feedback. This approach will help sharpen your market research presentation to give it the best shot possible.
- Create a follow-up plan: Ensure stakeholders follow your recommendations by holding them accountable with follow-up meetings. Make a plan to regroup with the team as needed to check in on action items. Pose questions to yourself and your stakeholders regarding the steps taken and the additional actions required by teams.
Additionally, it’s important to understand the limits of what you can propose. No matter how interesting your plan may be, if it's unfeasible, it won’t happen.
Set realistic strategic business recommendations
To win your stakeholders, you have to make your recommendations realistic and aligned to the overall business strategy.
- Focused: Start by referring back to your research brief. Ensure that your recommendations stem from the initial business question and are backed by your insights. Also, keep your recommendations focused on the audience you’re presenting to (e.g.: marketing recommendations to the marketing team).
- Specific: Stakeholders are less likely to implement vague recommendations. Ensure that your recommendations clearly outline specific actions to take. Maybe the next step is to do more research. In that case, be ready with a plan (and budget, if applicable).
- Attainable: If your recommendations are unrealistic, you’ll lose your audience to eye-rolls. If they are aggressive or require more resources than you currently have (whether it’s budget or headcount), outline what it would take to accomplish your recommendations.
- Measurable: Tie your recommendations to quantifiable business outcomes, or better yet, forecast the business impact of implementing your recommendations. Including metrics in your recommendations, even if based on assumptions, will help you sway your leadership team.
Ensuring that your recommendations meet these criteria will enhance the probability that your stakeholders opt to make your ideas a reality.
Market research case study
Across the board, market research can help your business push toward a data-driven future. A great example of this in action is Sakura of America.
Sakura utilized SurveyMonkey market research solutions to conduct an investigation into how the North American market approaches product development and design. Based in Japan, the majority of Sakura’s original research focused on the Japanese market.
SurveyMonkey offered a detailed insight into the target market, uncovering valuable insights into market size, competitive landscape, product positioning, and direct feedback from SurveyMonkey customers.
Sakura pinpointed new research and development initiatives that had the potential to succeed in the North American market.
Build effective market research surveys with SurveyMonkey
Market research is an effective tool that every business should utilize to its fullest. Say goodbye to making guesses and move toward a fully data-backed system that gets your business where you want it to be.
SurveyMonkey offers extensive support and fully managed market research initiatives. Whether you’re sending market research surveys or accessing SurveyMonkey Audience, our global survey panel, we have a solution for you.
Discover more resources

Understand your target market to fuel explosive brand growth
Brand marketing managers can use this toolkit to understand your target audience, grow your brand, and prove ROI.

B2B Thought Leadership Survey Template
Simplify your thought leadership collection with our B2B Thought Leadership Survey Template. Efficiently gather insights to enhance your content production.

Get ahead of the competition with real-time market insights using SurveyMonkey Audience panels
Learn how to use SurveyMonkey Audience panels to support your feedback programs.

Market research for marketers guide
Learn how to drive high impact marketing campaigns and events with SurveyMonkey.