SurveyMonkey Enterprise and Tableau
Connect SurveyMonkey with Tableau for a 360-degree view of your employee experience, customer support trends, and more.

Trusted by 260K+ organizations worldwide, including 95% of the Fortune 500




Explore the combined advantage of SurveyMonkey and Tableau for richer insights
Drive better decisions with a holistic picture of your data
- Sync results from any survey for up-to-date insights.
- Get a 360-degree view of your customers, your market, and more by combining operational data with feedback data.


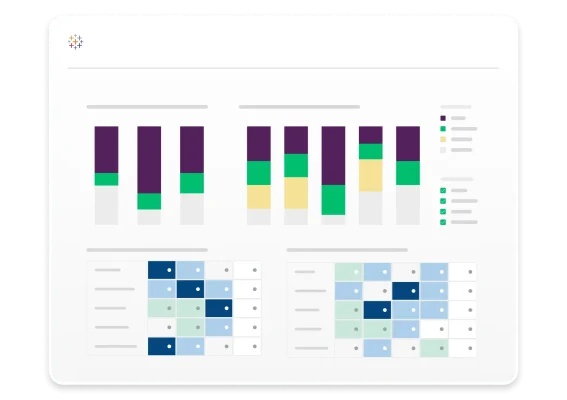
Get deeper insights through powerful visualizations
- Tap into the full power of Tableau’s market-leading analytics capabilities to uncover trends and opportunities.
- Build dashboards to compare feedback over time and drill down by metrics like customer size or geography.
Improve data sharing and collaboration
- Centralize and standardize how you share insights with key stakeholders.
- Empower your whole organization—from analysts to executives—to take action.
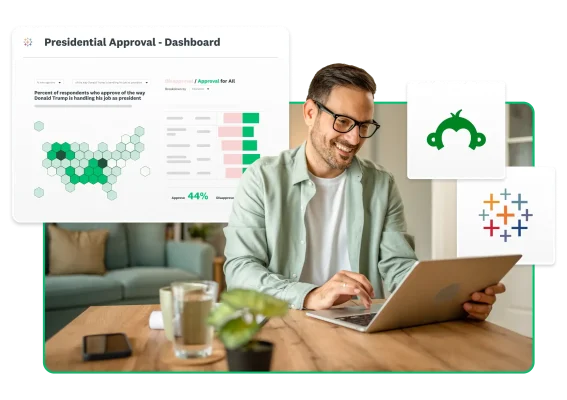
Discover how you can easily connect Tableau and SurveyMonkey
This integration is a paid add-on and only available to SurveyMonkey Enterprise customers.
Implementation is simple—just log in to your SurveyMonkey Enterprise account and follow step-by-step in-product guidance. And if you run into questions along the way, our team is here to help with resources.

“The marriage of SurveyMonkey and Tableau increases our team’s efficiency and ability to collaborate—and that provides real-time value to our agency and, in turn, our clients.”
Neil Owen
Executive Vice President
Ntara
Check out more ways to drive results with SurveyMonkey integrations

5 integrations to help you discover new insights
Tune in for a discussion on some of our most powerful integrations, including Tableau.

Connect feedback and operational data for deeper insights
Learn how combining customer insights with analytics tools like Tableau sparks richer insights.
Learn how to get started with Tableau and SurveyMonkey
Find out how to set up Tableau for your survey data with step-by-step guidance.

Explore more SurveyMonkey integrations
Get even more out of your survey data with 200+ apps and plug-ins.
Need an enterprise-grade solution?
SurveyMonkey Enterprise provides additional features like IT administration, SSO, user controls and permissions, HIPAA compliance and more.