Turn feedback into actionable insights with survey analysis
Get deeper insights about your customers, employees, and markets to drive growth in your organization—even if you’re not an analyst.

Trusted by 260K+ organizations worldwide
Tell a clear story—and drive the right outcomes—with the right analysis features

Get better insights and identify gaps to improve ROI quickly
Easily view and interpret results and dig deeper into your data to address growth gaps.
Quickly see summary and individual data
Explore real-time results, view individual responses, and automatically generate charts to help you easily understand and act on data.
Easily dig in with filters and compare results
Filter by answer, collector, time, and crosstabs. Compare results with combined filters, including similar question and answer types.
Hone in on nuanced insights with advanced logic
Use logic features to control the behavior of your survey and enhance the quality of your data. Narrow down results based on how people answer.
Know what people think about a product or experience
Visualize and understand your data so you can analyze insights, inspire action, and drive impactful outcomes.
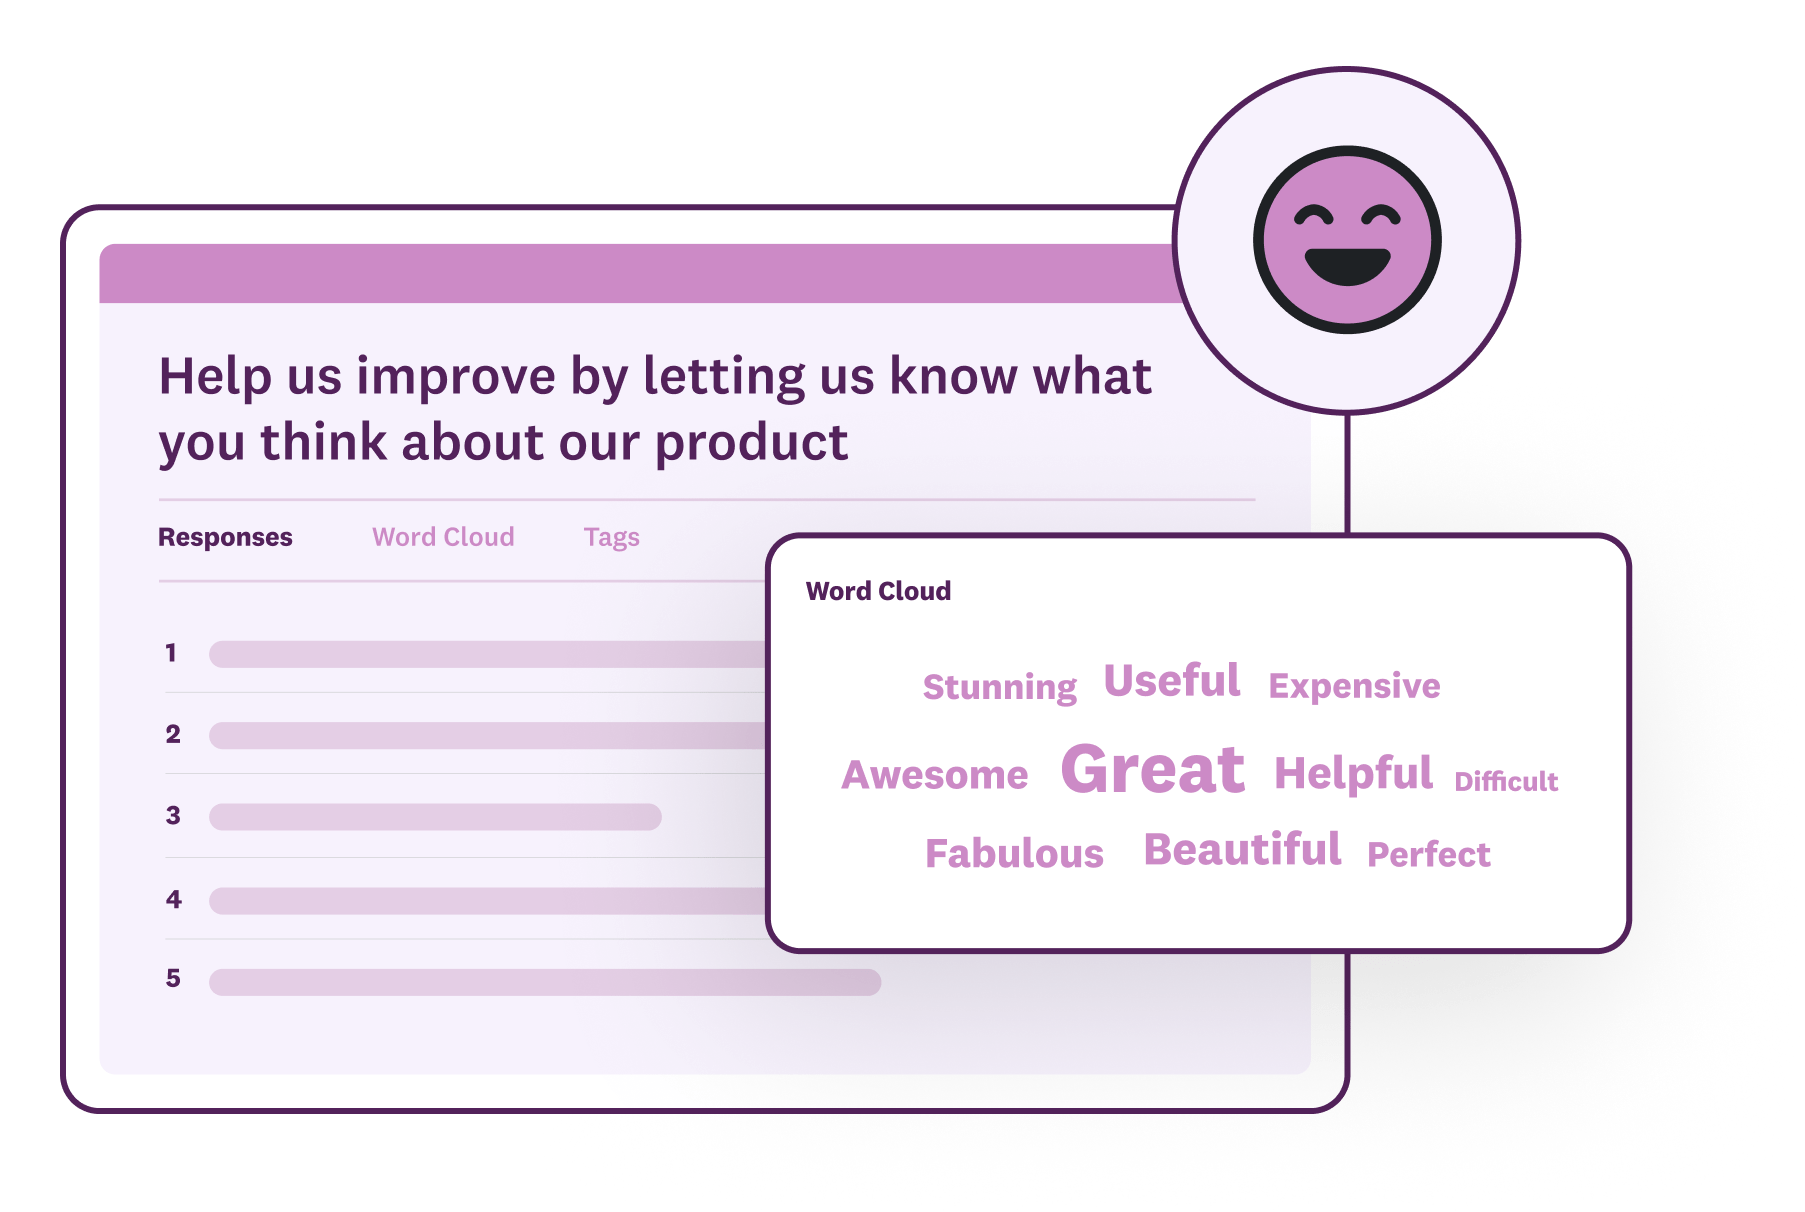
Create word clouds
Clearly understand your open-ended response data with custom word cloud visuals that use common words and phrases. Export the visuals as PNG images to include in reports and presentations.
Use sentiment analysis
Automatically categorize open-ended responses as positive, neutral, or negative with AI-powered analysis. Filter by sentiment to better understand key factors and drivers that are important to your customers.
Tag and organize responses
Label text responses with tags and colors so you can easily find data. Download survey data into a variety of formats, including CSV, HTML, XML, PDF, and more.

Tell impactful data-driven stories
Create custom reports and dashboards that provide data-driven insights you need to take action.
Build compelling data stories fast
Easily create and customize charts and tables that will help people across your organization understand the insights from your surveys.
Create custom multi-survey dashboards
Use multi-survey analysis to combine and analyze data across multiple surveys, monitor key metrics over time, and consolidate findings in an interactive dashboard.
Explore our entire library of templates
Create, launch, and collect responses faster with our expert-written templates.
See how SurveyMonkey analyze features empower teams across an organization
Empower your marketing team to analyze data for better results
Get the timely insights you need to drive growth, boost ROI, and inform brand strategy. Quickly pressure test ideas and get instant market feedback on products, ads, marketing messaging, and more.


Discover more about our products

Learn about team plans
With flexible settings and fast insights, SurveyMonkey team plans work the way your team works.

Analyze survey data
Learn best practices and see FAQs about analyzing data on the SurveyMonkey platform.

Take a tour of SurveyMonkey
Find out more about the SurveyMonkey platform. Learn how easy it is to find the answers you need with surveys and forms.

Turn survey results into slick presentations
Learn how you can easily turn all your data points into concise and compelling data stories for your stakeholders.
Discover more resources

Explore our toolkits
Discover our toolkits, designed to help you leverage feedback in your role or industry.

Survey templates
Explore 400+ expertly written, customizable survey templates. Create and send engaging surveys fast with SurveyMonkey.

Future of surveys: What our platform says about 2025
New proprietary data on survey trends, the growth in mobile surveys and why it signals new habits, new users, and better ways of collecting data.

Survey with file upload: How-to, examples, and tips
Forms gather vital info, but sometimes you need to conduct a survey with a file upload option. Here’s how to create a survey with file upload.
Get the insights you need to drive growth and innovation for your organization
NPS, Net Promoter & Net Promoter Score are registered trademarks of Satmetrix Systems, Inc., Bain & Company and Fred Reichheld.