How survey sample size works
Here’s what to consider when choosing how many people should get your survey.

You send surveys to better understand people: their opinions, behaviors, feedback, and more. But how do you know if what they say is a reliable representation of the population you’re trying to understand? Determining your survey sample size can help.
What is a survey sample size?
Sample size is the number of completed responses your survey receives. Your ideal sample size changes based on the total number of people in your target market or demographic.
That said, your survey sample size is just one factor that will help you decide if your survey results are meaningful or statistically significant.
Why is determining survey sample size important?
- When you want to survey your target market or perform demographic research, you can’t get answers from everyone. And even if you could, it would cost a lot of time and money.
- Determining a sample size for statistical significance, or the number of respondents you need, allows you to confidently survey fewer people.
- If you send your survey before thinking about sample size, understanding your sample size after the fact can help you analyze your survey data for statistical significance.
- Survey sample size can have varying degrees of importance based on your target population and the type of survey. For example, if you’re running medical or market research, it’s important to ensure the responses you get represent your population so you can make accurate predictions. If you’re surveying employees, you might pay more attention to the overall response rate, engagement, and individual feedback.
Sample size vs. response rate vs. completion rate
Before we show you how to determine survey sample size, it’s important to understand a few key terms:
- Survey sample size is the number of people who receive your survey.
- Response rate is the percentage of people who complete your survey.
- Your completion rate is how many people complete your survey and submit their answers.
For example, you might send your survey to a sample size of 1,000 people. If 400 people open your survey, your response rate is 40%. In most cases, not everyone who opens your survey will complete it. If 400 people open your survey, but only 200 people submit their responses, your completion rate is 50%.
Although response and completion rates don’t directly impact your sample size initially, it’s important to consider these variables when choosing your sample size.
That’s because when you choose a sample to represent your target population, you’ll want to account for the fact that not everyone who gets your survey will complete it, potentially impacting your statistical significance.
How to determine sample size for survey research (+ example)
Imagine you want to test an idea for a new product. You know your typical customers are in a certain age and salary range. They also tend to live in and around urban areas in the US. This group is your population, the target audience you want to understand.
You’ve got your population, which is the total number of people you are studying or want to understand. For this example, let’s say there are 10,000,000 people in your population.
Next, you should choose your margin of error. Your margin of error is how sure you are that your survey responses represent the views of your population.
People commonly choose a 5% margin of error for their survey research. This means you add and subtract 5% to either side of your data to account for any errors.
For example, let’s say 60% of people who completed your survey say they’d buy your new product. Because your margin of error is 5%, you can conclude that it’s actually 55-65% who would buy your new product.
Finally, you want to choose your confidence level. Your confidence level is the probability that you’d get the same results if you sent the survey to another sample of your target population.
For this example, you send your survey to 1,000 people. With your margin of error, you conclude that 55-65% would buy your new product. How confident are you in these results?
You choose a confidence level of 95%, which is the industry standard. With this, you decide that if you sent the same survey to a sample of 1,000 again and again, you’d get the same results 95% of the time.
Calculate your survey sample size
Now that you’ve got your population, margin of error, and desired confidence level, it’s time to determine your survey sample size. Remember, sample size is how many people you send your survey to. You can use our sample size calculator or use this survey sample size formula to figure it out:
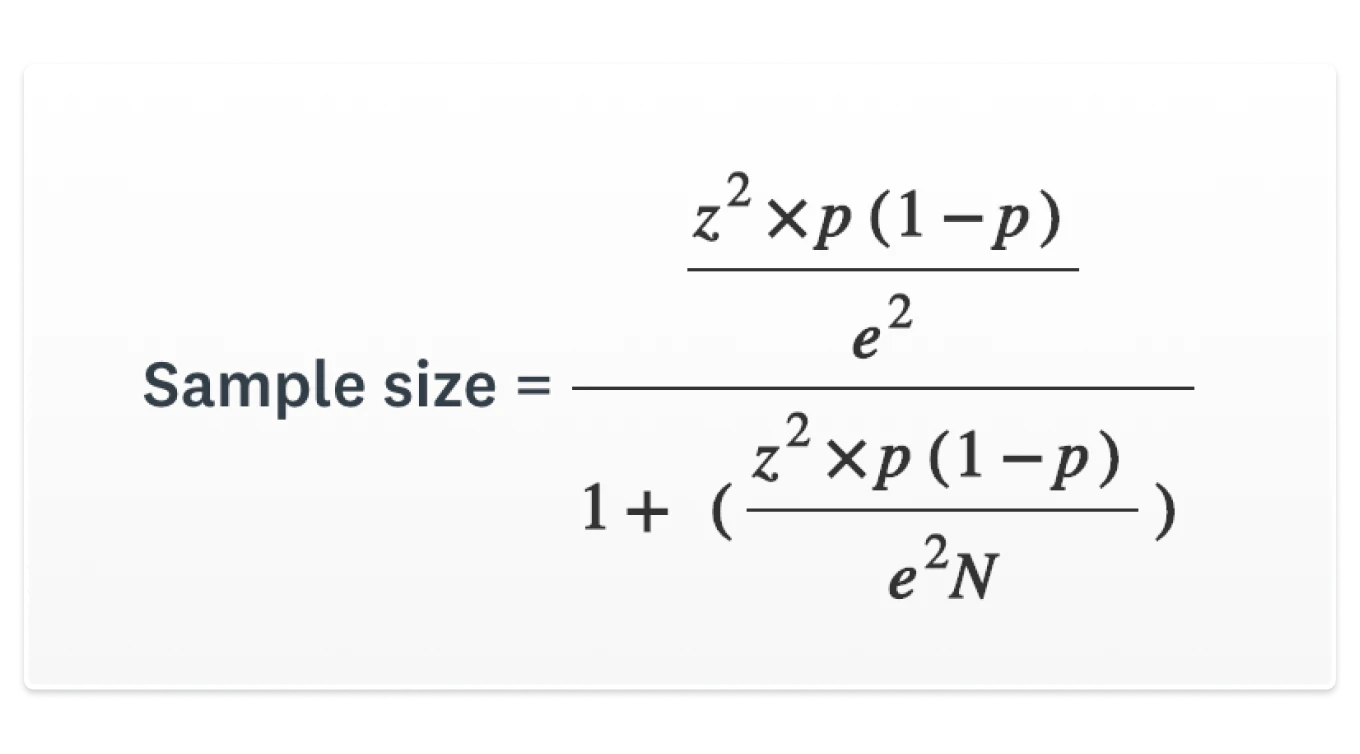
- N = population
- e = margin of error (percentage in decimal form)
- z = z-score* (how many standard deviations data is from the mean)
*95% confidence level is a 1.96 z-score
Using this formula, if our population is 10,000,000 with a margin of error of 5% (0.05) and 95% confidence level (1.96 z-score), our sample size is 385. But there’s more to sample size than just the number.
Once you've determined your target sample size, you'll need a reliable method to randomly select participants. Learn how to create a random sample using Excel to efficiently select survey recipients while maintaining proper randomization principles.
What is a good sample size for survey research?
Generally, the larger your sample size, the better chances your results will be statistically significant. However, sample size importance can change based on these variables:
- Type of survey you’re running: Let’s say you’re conducting research in another country to see if your product will have a good market fit. Because you’re making a big business decision based on your results, you’ll want to consider a sample size that corresponds to a smaller margin of error. But if you’re collecting qualitative feedback from the 20 people who just attended your event, you’ll probably pay more attention to the five thoughtfully written responses than your overall statistical significance.
- Diversity of your population: Think about the demographics of your target audience
—gender, age, ethnicity, location, marital status, education, and more. If the characteristics of the people in your target population are similar, you can probably be more comfortable with fewer responses. But if their characteristics vary widely, you’ll want to survey more people for a more accurate representation of your population.
- The decisions you’re making: When you make decisions based on survey results, it makes sense that more data might help. But more isn’t the only thing to consider. Remember your audience. If you’re trying to collect ideas or feedback to help you make small changes or improvements, you might be willing to accept fewer responses. For more wide-reaching or impactful decisions that’ll cost you a lot of resources, you’ll want more responses to be comfortable with your results.
Choosing a minimum sample size for survey research
Want a quick estimate of how many people need to take your survey? Here’s a handy table to help you decide. All you need is the number of people in your target population and your desired margin of error (3-10%).
| Population | ±3% | ±5% | ±10% |
| 500 | 345 | 220 | 80 |
| 1,000 | 525 | 285 | 90 |
| 3,000 | 810 | 350 | 100 |
| 5,000 | 910 | 370 | 100 |
| 10,000 | 1,000 | 385 | 100 |
| 100,000 | 1,100 | 400 | 100 |
| 1,000,000 | 1,100 | 400 | 100 |
| 10,000,000 | 1,100 | 400 | 100 |
*Percentages represent 3%, 5%, and 10% margin of error
For example, if you’re running medical research, you might stick to a lower margin of error, like 3%. But if you’re choosing a customer satisfaction survey sample size, you might be more comfortable with a higher margin of error, like 10%.
Different types of sampling design
When choosing your sample size, it’s important to consider your sampling design. Sampling design is the method used to get a representative sample for your survey.
With a carefully designed sample, you can help reduce sampling bias, which is when your survey sample doesn’t accurately represent your target population. Here’s a quick overview of the different types of sampling to consider for your survey.
Probability sampling
Probability sampling is when each person in your target population has an equal chance of being chosen for your survey.
There are four main types of probability sampling.
- Simple random: Use a lottery method or randomization to ensure each member of your population is equally likely to be chosen. This can be difficult for large populations, but it is an easy way to avoid sampling bias.
- Cluster: Divide your target population into clusters or groupings, then choose a random sample of clusters. Survey everyone in your chosen clusters. This can lead to bias if cluster demographics vary too widely. But cluster sampling can be more practical for populations that are spread out or difficult to reach.
- Systematic: To perform systematic sampling, choose people in your target population regularly, like choosing every 50th person on a list of 5,000 people. If your list order is prone to bias, this could be a problem, but overall, this can be an effective sampling method.
- Stratified: Sort your population into different strata or layers, like gender, income, or location. Then, randomly sample people in each stratum. This can help you get a good representation of each demographic in your population, but it can be more complicated and time-consuming.
Non-probability sampling
Non-probability sampling is when people in your target population don’t have an equal chance of being selected.
While non-probability sampling can be easier and less expensive, it can be more prone to sampling bias. This can impact the reliability of your survey results.
There are five main types of non-probability sampling.
- Convenience: Survey people who are the most accessible. While it’s easy to get survey responses, you can’t be confident that the results represent your target population.
- Judgemental or purposive: Survey people you think will help you reach your research goals. You might use this for qualitative research, where you don’t need a large amount of quantitative data to reach conclusions.
- Voluntary response: People volunteer to take your survey. Certain people might be more likely or able to take your survey, leading to sampling bias.
- Snowball: Send your survey to people, asking them to recruit others for your survey. This can help you get more survey respondents, but you might only reach a certain demographic in your overall target population.
- Quota: Separate your population into categories that are important for your research. Then, choose several people in each category to survey. This method is prone to bias but can lead to fast feedback.
Need help choosing your sample size?
From expert sampling design to surveying your target market, SurveyMonkey Audience gets you reliable market insights, fast.