How to measure customer experience: CX metrics and KPIs to track
Discover key metrics and KPIs to measure customer experience effectively. Improve satisfaction and loyalty with actionable insights.

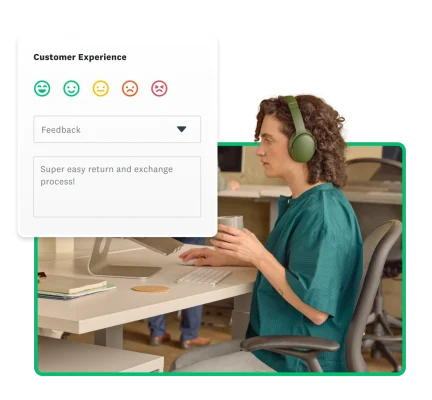
Consistently measuring customer experience (CX) is essential for business success. When you understand how customers perceive their interactions with your brand, you can make strategic improvements to the customer journey that enhance satisfaction, build loyalty, and drive growth. Organizations need a structured approach to measuring customer sentiment and behavior to capture this value.
Measuring customer experience: What is it?
Customer experience encompasses every interaction a person has with your company—from initial awareness to post-purchase support. It's the sum of all experiences, emotions, and perceptions formed during these interactions. Great CX doesn't happen by accident; it requires deliberate design and continuous improvement based on customer feedback and behavior analysis. A positive experience can drive loyalty, increase retention, and turn customers into brand advocates.
CX is a multifaceted concept that involves various aspects, including:
- Customer satisfaction: How happy customers are with a product, service, or interaction.
- Customer effort: The ease or difficulty customers experience when interacting with a brand.
- Customer loyalty: The likelihood of customers to return, recommend, and advocate for a brand.
- Customer lifetime value: The total value a customer brings to a business over their lifetime.
By grasping these elements, businesses can design and implement effective CX strategies that meet customer needs, exceed expectations, and foster long-term relationships. Focusing on customer satisfaction, reducing customer effort, and enhancing customer loyalty can significantly increase customer lifetime value, driving sustainable growth and competitive advantage.
6 reasons why measuring customer experience is important
Tracking and analyzing customer experience metrics across the customer journey provides transformative business insights. Surveys are a primary tool for collecting customer experience data, providing direct feedback on satisfaction and sentiment. Here's why measuring CX matters:
1. Improves customer satisfaction and drives loyalty
Understanding what makes customers happy allows you to enhance positive experiences and address pain points. Key customer experience metrics, such as customer satisfaction scores and net promoter scores, play a crucial role in tracking and improving customer satisfaction and loyalty. Tracking your customer satisfaction score provides concrete evidence of how your improvement efforts impact perception, helping you build a loyal customer base that chooses your brand over competitors.
Ready to get customer satisfaction feedback?
Start with our Customer Satisfaction Survey Template.
2. Identifies pain points and enhances the customer journey
Customer experience metrics highlight struggles customers face, helping you prioritize improvements. Measuring customer interaction can identify and address friction points in the customer journey. Data collected at friction points offers invaluable insights into specific issues, allowing you to develop targeted solutions that enhance customer satisfaction at critical touchpoints.
3. Boosts retention while reducing churn
Satisfied customers stay loyal, reducing acquisition costs and increasing lifetime value. By identifying why customers leave through analyzing trends in your customer satisfaction scores across segments, you can implement retention strategies before it's too late, maintaining relationships that survive competitive offers and market changes.
4. Increases customer lifetime value through personalization
Happy customers spend more. By analyzing purchase patterns based on customer data, you can create tailored experiences that resonate with individuals, driving loyal customers to increase both spending and engagement. Personalization transforms satisfaction into measurable revenue growth, with recommendations typically increasing conversion rates.
5. Provides actionable insights for strategic growth
CX metrics translate customer feedback into business strategy. They reveal exactly where to innovate, helping you differentiate your brand through targeted experience improvements. These insights transform satisfaction into competitive advantage—turning happy customers into vocal advocates who drive sustainable growth through authentic word-of-mouth marketing that outperforms paid acquisition channels.
6. Supports continuous improvement across your business
Regular feedback creates a cycle of ongoing enhancement for products and services. By systematically tracking customer satisfaction scores across your offerings, you can implement targeted CX strategies that evolve with changing expectations and market conditions, ensuring your business remains relevant and competitive.
Key metrics and KPIs for measuring customer experience
Understanding which customer metrics to track and how to measure them will give you visibility into how well your organization meets customer expectations at every stage of the journey.
Customer experience KPIs are the specific metrics you've identified as most critical to measuring success against your strategic CX objectives.
While metrics are the quantifiable measurements you track regularly, KPIs (Key Performance Indicators) are the specific metrics you've identified as most critical to measuring success against your strategic CX objectives. Not all metrics need to be KPIs, but all KPIs are metrics that directly align with your business goals.
1. Net Promoter Score® (NPS)
Net Promoter Score is the world's leading customer experience KPI for measuring customer loyalty. It comes from the question, "How likely would you be to recommend our company to a friend or colleague?" The answer choices fall under a scale from 0 (lowest) to 10 (highest). NPS is a commonly used metric because it is easy to understand and quick to complete.
Based on the responses, you can segment respondents into the following groups:
- Promoters (9 or 10 rating): Your happiest customers who are the most likely to buy more from you and refer your product/service to someone else.
- Passives (7 or 8 rating): Relatively satisfied with your product or service, but a subtle change in your business—whether it's product/service or pricing-related—or an improvement from a rival could cause them to leave you.
- Detractors (0-6 rating): Your least happy customers, most likely to churn and tell others about their negative experiences with your business.
The metric is widely measured, so you can easily benchmark your NPS score to see where you stand among industry competitors.
What NPS tells you
NPS allows you to determine whether or not your customers will say something positive about your brand and gives you a holistic understanding of how customers feel. An increase in NPS suggests high customer satisfaction, which can lead to increased profitability and future growth.
How to calculate NPS

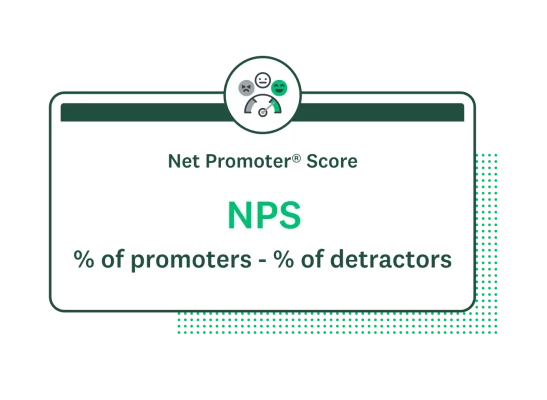
To calculate your NPS, subtract the percentage of detractors from the percentage of promoters:
- NPS = % Promoters - % Detractors
The result is an overall score that ranges from -100 (lowest) to +100 (highest).
When to choose NPS as your primary KPI
Choose NPS as your primary KPI when brand reputation and customer advocacy are critical to your business growth strategy, such as in competitive markets where word-of-mouth referrals significantly impact acquisition costs.
2. The Customer Effort Score (CES)
Unlike the NPS, the Customer Effort Score (CES) asks for feedback on a single experience. More specifically, it focuses on understanding how easy or difficult it was to solve an issue with your team. Effective measurement of customer interaction, such as through the CES, can uncover friction points in the customer journey and ultimately enhance overall satisfaction and loyalty.
The CES survey asks customers to agree or disagree with the statement: “[Company name] made it easy for me to handle my issue.” You can include five answer choices that range from “Strongly agree” to “Strongly disagree.”
You can measure CES questions to gather insight by following website visits, online checkouts, service sign-ups, sales interactions, or another customer-business touchpoint.
What CES tells you
Customer Effort Score tells you how your products and services perform in specific areas. It’s a simple measure that gives you direct insight into a recent customer experience with your company. Research shows that reducing customer effort is a stronger indicator of loyalty than delight, making this metric particularly valuable for service interactions throughout the customer journey.
How to calculate Customer Effort Score

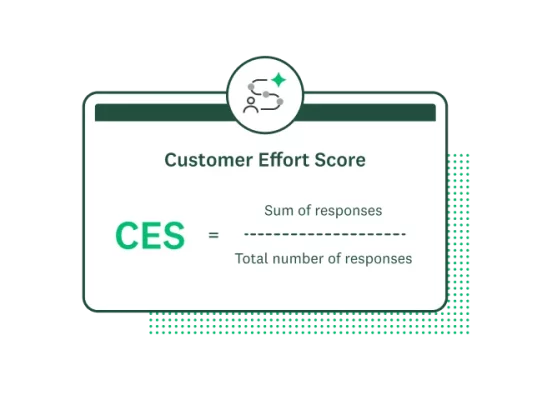
To calculate the score, first assign a numeric value to each choice. “Strongly agree” would receive a 1 rating, “Agree” would get a 2— all the way up to “Strongly disagree,” which would receive a 5. Then, calculate your average score:
- CES = Sum of all scores / Number of respondents
A lower average rating means a more effortless customer experience.
When to choose CES as your primary KPI
Choose CES as your primary KPI when reducing customer friction and streamlining service experiences are critical business priorities. For example, when implementing new self-service tools, optimizing support processes, or redesigning customer journey touchpoints that have historically caused frustration.
3. The Customer Satisfaction Score (CSAT)
The Customer Satisfaction Score measures overall customer satisfaction with products and services. Key customer experience metrics, such as CSAT, are essential for tracking customer interactions and assessing service quality. You can use a CSAT score to measure various areas of satisfaction in your business rather than just one area. High CSAT scores generally indicate that customers are satisfied with the services or products offered.
The customer satisfaction survey asks:
- “How would you rate your experience with our [brand/product/service]?” with answer choices that range from very satisfied to very dissatisfied.
What CSAT tells you
On a scale of 1-10, 1-5, or 1-3, the CSAT score gives your business an idea of the overall satisfaction with an area of your business. As you can track multiple areas, like purchases, support, and shipping, you can compare overall business satisfaction segments against one another. While NPS focuses on whether or not a customer would recommend you, the CSAT is overall satisfaction with certain areas.
How to calculate CSAT

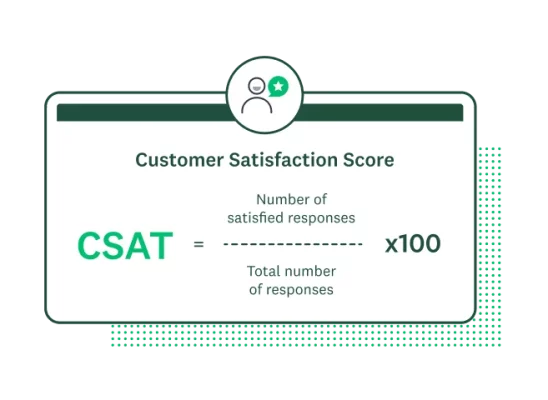
To get your CSAT score, take the number of respondents who mark themselves as satisfied (they either selected the answer choices “satisfied” or “very satisfied”) and divide it by the total number of respondents. Then, multiply the result by 100 so it’s converted into a percentage:
- CSAT = (Number of satisfied respondents / Total number of respondents) × 100
A higher percentage means a higher level of satisfaction. You can measure the CSAT score after a customer receives support from your team or after receiving a product.
When to choose CSAT as your primary KPI
Choose CSAT as your primary KPI when immediate satisfaction with specific touchpoints or transactions is crucial to your business, such as in retail environments, after product launches, or when measuring the impact of service improvements.
4. Customer lifetime value (CLV)
Customer lifetime value (CLV) lets your business measure the expected revenue from a customer across their whole journey with your brand. It pulls data from every purchase a customer has made. Improving customer satisfaction leads to a higher CLV.
What CLV tells you
CLV tells your business how much revenue you have generated from a certain customer throughout their relationships with your company. It helps you determine a customer's long-term value, helping you make more effective budgetary decisions in marketing and customer acquisition.
How to calculate CLV
The simplest way to calculate customer lifetime value is to determine the average purchase cost and multiply that by the number of customer purchases across their journey:
- CLV = Average Purchase Value × Average Purchase Frequency × Average Customer Lifespan
You can calculate CLV across individual customers, customer segments, marketing channels, or your entire company.
When to choose customer lifetime value as your primary KPI
Choose customer lifetime value as your primary KPI when profitability and long-term customer relationships are strategic priorities, particularly in subscription businesses or industries with high acquisition costs where retention drives profitability.
5. Customer retention rate
Customer retention rate lets you measure how effective your company is at keeping your existing customers from churning. The higher your retention rate, the more likely you are to have a high customer satisfaction rate.
What customer retention rate tells you
Your customer retention rate tells you whether your customers are happy enough with your products and services to remain your customers. On the other hand, a low retention rate could signal that your customers have issues with the quality of what you offer.
How to calculate customer retention rate
To calculate your customer retention rate, you need to know the number of customers acquired during a certain period, the customers you had at the start, and the customers you have at the end. Once you have that information, use the following formula:
- Retention Rate = [(Number of Customers at End of Period - New Customers Acquired During Period) / Number of Customers at Start of Period] × 100
When to choose retention rate as your primary KPI
Choose retention rate as your primary KPI when customer loyalty is central to your business model, such as in subscription services, membership organizations, or industries where repeat business forms the foundation of revenue stability.
6. Customer churn rate
Customer churn rate is the direct opposite of your customer retention rate. Instead of tracking how many customers remain loyal to your business, you work out how many have stopped paying for your products or services. Monitoring churn rates helps you pinpoint how effective your customer retention strategies are in improving the customer experience.
What customer churn rate tells you
The churn rate reflects the number of customers that have lost interest in your products or services. The most useful part of calculating your churn rate is doing so for different parts of your product lifecycle.
How to calculate customer churn rate
To calculate the churn rate formula, you first need to select a period of time. Record how many customers you had at the start of this period and the number of customers you lost:
- Churn Rate = (Lost Customers ÷ Total Customers at Start of Period) × 100
When to choose churn rate as your primary KPI
Choose churn rate as your primary KPI when stemming customer losses is a critical priority, such as during market disruption, after price changes, or when facing increased competitive pressure
7. Average response time
When responding to customer inquiries, the longer you let a customer wait, the more likely they will feel frustrated. A low average response time is a marker of an effective customer support department. This metric is a good measure of how responsive your support teams are.
What average response time tells you
The average response time will tell you how long it takes for your customer support to reply to a customer inquiry. You can measure the average response time across any customer-facing channel, like email, live chat, or even in-browser chatting.
How to calculate average response time
To calculate the average response time of your support teams, add all of the response times together and then divide by the total number of inquiries:
- Average Response Time = Total Response Time / Number of Customer Inquiries
The lower the response time, the more efficient your team is at responding to inquiries and the better the customer experience.
When to choose average response time as your primary KPI
Choose average response time as your primary KPI when speed of service is a key differentiator in your market, particularly in crisis management, emergency services, or real-time support environments.
8. Average resolution time (ART)
ART is the total amount of time it takes for a support agent to solve your customer's issue. Unlike average response time, this is not only the first moment of contact but a measure of the entire process. For some problems, the ART may be much more than others.
What average resolution time tells you
A short ART suggests that your support team efficiently solves customer problems so that they'll have a positive customer experience. If a support agent has a low average resolution time, it could suggest that they are efficient at their job, which your customers will love.
How to calculate average resolution time
You can calculate the average resolution time from when the customer opens the inquiry or your support agent's first response:
- ART = Total Time to Resolve All Requests / Number of Requests
The lower your ART, the better your customer support experience will be.
When to choose ART as your primary KPI
Choose ART as your primary KPI when complete problem resolution drives satisfaction in your industry, such as in technical support, complex service environments, or when handling high-value customer issues.
9. Customer referral rate
The customer referral rate (CRR) is similar to NPS as it gives you information about customer opinions of your brand. However, while NPS tells you how likely a customer is to refer your business to a friend, the CRR shows the number of customers that are doing so. It's a concrete metric that's accuracy is a significant advantage over NPS.
What customer referral rate tells you
Your CRR tells you how many of your new purchases come from customer referrals. Since customers typically recommend products and services they've had positive experiences with, CRR can reflect overall customer satisfaction.
How to calculate customer referral rate
To calculate the CRR, you need to know how many total sales you've had in any one period and how many sales came from a referral:
- Referral Rate = (Number of Referred Sales / Total Number of Sales) × 100
When to choose CRR as your primary KPI
Choose CRR as your primary KPI when your growth strategy heavily relies on referral marketing, such as in professional services, luxury markets, or businesses with strong community elements.
How to measure customer experience
Implement a high-impact CX measurement program with these five critical steps:
1. Define objectives and map the journey
Set specific, measurable CX goals aligned with business strategy, such as increasing retention by 10%. Create a visual touchpoint map spanning from awareness through purchase to loyalty, identifying the moments that matter most to customers.
2. Select tailored metrics for key touchpoints
Choose key customer experience metrics that match your objectives and specific interaction points. Deploy CSAT for support quality, CES for process efficiency, and NPS for overall loyalty. Different journey stages require different measurement approaches.
3. Collect multi-dimensional feedback
Deploy strategic surveys at critical moments in the customer experience using both quantitative scales and qualitative responses. Timing matters—measure satisfaction immediately after support interactions but wait 7-14 days after purchases to assess true satisfaction.
4. Analyze patterns and prioritize improvements
Identify correlations between experience metrics and business outcomes. Customer interaction plays a crucial role in analyzing patterns and identifying improvement opportunities. Cross-reference customer feedback with operational data to pinpoint the highest-impact improvement opportunities that improve customer experience, drive loyalty, and reduce costs simultaneously.
5. Implement changes and monitor results
Execute targeted improvements based on your findings, ensuring cross-functional alignment. Establish a continuous measurement system to track impact, creating a closed-loop process where measurement drives action and refinement.
Best practices for measuring customer experience
To maximize your CX measurement program, implement these five proven approaches:
- Track metrics consistently - Establish a regular cadence for collecting data to identify trends over time. Monthly dashboards with key metrics drive accountability and reveal seasonal patterns affecting loyalty.
- Blend quantitative with qualitative - Numbers reveal what's happening, but customer comments explain why. Use journey-based surveys for scores, then follow up with interviews to uncover emotional drivers behind the metrics.
- Segment strategically - Break data down by customer value tiers, product usage, and acquisition channels. Different segments have distinct expectations—what delights new users may simply meet basic needs for power users.
- Close the feedback loop - Acknowledge input, communicate changes, and share results. When customers see their feedback driving real improvements, response rates increase by up to 30%.
- Benchmark competitively - Compare your metrics against industry leaders, not just averages. Identify experience gaps where exceeding expectations by just 10% could create a significant competitive advantage.
Analyzing customer feedback
Analyzing customer feedback is a critical step in understanding customer experience. Feedback provides valuable insights into customer perceptions, preferences, and pain points, enabling businesses to identify areas for improvement and optimize their CX strategies.
There are various methods for collecting customer feedback, including:
- Surveys: Structured questionnaires that gather quantitative and qualitative data.
- Social media listening: Monitoring social media platforms to capture customer conversations and sentiment.
- Customer reviews: Analyzing online reviews to understand customer experiences and opinions.
- Net Promoter Score (NPS): A metric that measures customer loyalty and satisfaction.
By analyzing customer feedback, businesses can:
- Identify trends and patterns in customer behavior and sentiment.
- Pinpoint areas for improvement in products, services, and interactions.
- Develop targeted CX initiatives that address customer needs and concerns.
- Measure the effectiveness of CX strategies and make data-driven decisions.
Understanding customer sentiments through feedback helps businesses create more personalized and effective customer experiences, ultimately leading to higher customer loyalty and reduced churn.
Creating a customer experience dashboard
A dashboard for customer experience management serves as a visual representation of key CX metrics and data, providing a centralized platform for monitoring, analyzing, and improving customer experience. A well-designed dashboard enables businesses to:
- Track CX performance in real-time.
- Identify trends and patterns in customer behavior and sentiment.
- Analyze the effectiveness of CX initiatives and strategies.
- Make data-driven decisions that drive customer-centric growth.
When creating a customer experience dashboard, businesses should consider the following key elements:
- Customer satisfaction metrics (e.g., CSAT, NPS).
- Customer effort metrics (e.g., CES, FCR).
- Customer loyalty metrics (e.g., retention rate, churn rate).
- Customer lifetime value metrics (e.g., CLV, customer acquisition cost).
- Net Promoter Score (NPS) and customer sentiment analysis.
By incorporating these elements, businesses can create a comprehensive dashboard that provides a 360-degree view of customer experience, enabling them to optimize their CX strategies and drive long-term growth. A well-maintained dashboard helps in continuously measuring and improving customer interactions, ensuring a positive and consistent customer experience across all touchpoints.
How to improve customer experience
Once you've measured and analyzed your customer experience, use these strategies to drive meaningful improvements:
- Personalize interactions and streamline processes
Tailor offerings based on customer preferences and behavior. Eliminate unnecessary steps and confusing policies that create friction, making it easy for customers to do business with you at every stage. - Provide seamless omnichannel support
Deliver consistent service across all channels—in-person, online, mobile, and social media. Allow customers to switch between channels while maintaining the context of their interaction history. - Implement proactive customer service
Anticipate needs and address potential issues before they become complaints. Send timely information and maintenance reminders to prevent frustration and demonstrate attentiveness. - Leverage technology and customer feedback
Deploy tools that enhance customer experience while actively collecting feedback across multiple channels. Use these insights to continuously improve your offerings and close the feedback loop with customers. - Invest in employee training and emotional connections
Equip your team with skills to deliver exceptional customer experiences. Focus on creating meaningful moments that resonate emotionally with customers, showing you value the relationship beyond transactions.
Improve customer experience with SurveyMonkey
Understanding and measuring customer experience is essential for business success. By implementing the right customer experience metrics and following best practices, you can gain valuable insights into how customers perceive their interactions with your brand and identify opportunities for improvement.
Remember that measuring customer experience is not a one-time effort but an ongoing process of listening, analyzing, implementing changes, and measuring results.
Start enhancing CX today with comprehensive tools and templates designed to capture the voice of your customers and transform feedback into action. Get started in minutes with an expertly crafted Customer Feedback Template.
NPS, Net Promoter & Net Promoter Score are registered trademarks of Satmetrix Systems, Inc., Bain & Company and Fred Reichheld.
Put customer experience at the heart of your business
Get the insights you need to delight and retain customers.
Discover more resources

Solutions for your role
SurveyMonkey can help you do your job better. Discover how to make a bigger impact with winning strategies, products, experiences, and more.

Why are surveys important in research?
Surveys are important in research because they offer a flexible and dependable method of gathering crucial data. Learn more today.

NPS surveys: Best practices for high response rates
Learn NPS survey best practices to drive high response rates by improving survey processes.

23 ways to increase CSAT response rates
It's hard to improve your customer satisfaction scores without respondents. Get SurveyMonkey's best actionable tips to improve your response rate.