What is a Likert scale? Definition, examples, analysis & best practices
What is a Likert scale? Likert scales are reliable for measuring opinions, perceptions, and behaviors. Learn how to use it and analyze results.

Agree/disagree survey questions have a place in market research. However, when you need to capture the subtle degrees of feeling behind a response, a Likert scale question is your best bet for getting more nuanced data.
A Likert scale is a survey format that measures opinions, attitudes, or behaviors across a range, providing a structured way to capture intensity of feeling, from strong agreement to strong disagreement. It allows you to see how strongly people agree, how satisfied they feel, or how likely they are to act, distinguishing mild satisfaction (“meh”) from strong enthusiasm (“love”).
In this guide, you’ll learn the fundamentals of the Likert scale, how to pick the right number of points, and how to write clear, well-labeled questions that respondents can easily answer.
What is a Likert scale?
A Likert scale is a survey format that measures opinions, attitudes, or behaviors across a range, providing a structured way to capture intensity of feeling, from strong agreement to strong disagreement.
Using Likert scales, researchers and practitioners can effectively quantify and capture the nuance of individual opinions, psychology, and attitudes. For instance, someone who likes the product but is not crazy about it would probably give a Likert rating of "Somewhat like it."
While we can simplify customers’ attitudes toward a product as like or dislike, Likert scales offer us additional granularity, moving from “Like” to “Like a great deal.”
How to write Likert scale questions and responses

Crafting effective Likert scale questions is not merely a best practice; it is the absolute foundation for generating survey data that is both statistically valid and practically actionable.
A successful scale requires comprehensive and balanced answer options that capture the full spectrum of attitudes—from “Strongly disagree” to “Strongly agree.”
By mastering these precise techniques, you unlock powerful, reliable insights, ensuring your data moves beyond passive feedback to become the essential, meaningful input that drives confident, strategic decision-making.
1. Write (and re-write) your Likert scale question for clarity
Maximizing the effectiveness of your Likert scale hinges on precise phrasing—and that means asking questions, not just making statements.
When you use a statement (e.g., "The service was excellent"), you run into a critical pitfall: acquiescence bias. Survey respondents tend to agree rather than disagree, often inflating positive responses and skewing your data. To combat this ingrained psychological preference, frame your items as direct questions. For example, “What is your satisfaction level with the service?”
Beyond bias, vague phrasing yields useless data. To transform general opinions into useful, actionable insights, you must ruthlessly define your variables. For instance, when evaluating restaurant service, don't just ask about "service." Instead, break it down:
- Specify the person: Are you evaluating the valet, the host, or the waiter?
- Specify the aspect: Are you interested in the speed of service, the courtesy, or the quality of the food?
By spelling out exactly what you want to know—turning vague notions into focused inquiries—you achieve the precision necessary for reliable measurement and confident decision-making.
2. Match the labels to the construct
Using the standard agree/disagree anchors for every question can undermine the precision of your data. The secret to a truly effective Likert scale lies in ensuring the response labels perfectly match the construct (the concept) you are trying to measure.
When you select your response anchors, you are setting the semantic context for the entire measurement. Using the correct vocabulary is essential to elicit the most accurate response when measuring other concepts:
- Attitude (Opinion/belief): Use the agreement scale, ranging from "Strongly disagree" to "Strongly agree."
- Experience (Feeling/evaluation): Use the satisfaction scale, ranging from "Not at all satisfied" to "Extremely satisfied."
- Priority (Value/significance): Use the importance scale, ranging from "Not at all important" to "Extremely important."
- Probability (Future intent/chance): Use the likelihood scale, ranging from "Not at all likely" to "Extremely likely."
- Behavior (Rate of action): Use the frequency scale, ranging from "Never" to "Always."
While agreement is perfect for assessing beliefs, it may not capture the nuance you need. A respondent who "Strongly agrees" with using the app daily hasn't told you how often they use it. Matching the scale vocabulary to your core construct is a simple yet powerful step toward achieving truly reliable, unambiguous data.
3. Choose bipolar or unipolar options
Bipolar constructs are those where attitudes can fall on one side or the other of a midpoint that itself is true ambivalence or neutrality. For example:
How informative or uninformative was the keynote presentation?
- Very uninformative
- Somewhat uninformative
- Somewhat informative
- Very informative
Unipolar constructs are those that lend themselves strictly to an amount and don't have a neutral midpoint–either there is the maximum amount of the attitude or none of it. For example:
How comfortable do you feel expressing your thoughts and opinions at work?
- Very comfortable
- Somewhat comfortable
- Not too comfortable
- Not comfortable at all
When to use Likert questions
Likert scale questions can be found in almost every type of survey, including customer satisfaction research, employee engagement studies, and product experience feedback.
- Customer experience: Track satisfaction Likert scale metrics with CSAT and loyalty with NPS. These scales help you spot what delights customers and where service improvements can increase retention. Get started fast with customer satisfaction templates.
- Employee engagement: Measure engagement and manager support with our Employee Engagement Survey Template. The results show how connected employees feel to your mission and where leadership can improve communication or development.
- Website or product UX: Use likelihood and agreement questions to measure task success and perceived ease of use. These insights reveal friction points in design, so teams can make the experience smoother and more intuitive.
- Market preferences: Use importance scales to prioritize features for roadmaps. This helps product teams focus on what customers value most, resulting in products that meet real needs, increase satisfaction, and deliver stronger ROI.
- Event feedback: Likert scale frequency and satisfaction items quickly show what to repeat or fix. You’ll learn which sessions or experiences resonated with attendees and how to improve future events.
5 best practices for writing clear Likert scale questions
Don't leave your data's quality to chance. Following these five best practices is the roadmap to success: it ensures every respondent interprets your options consistently, ultimately maximizing the reliability and actionability of your feedback, turning opinions into measurable organizational drivers.
- Ask a single, specific question per item. Each question should focus on one idea so results reflect a single attitude. Combining multiple ideas, like price and quality, makes it hard to tell which one drove the response.
- Keep polarity consistent across items (all low→high). When all scales run in the same direction, respondents move faster and make fewer mistakes. Flipping directions mid-survey can lead to confusion or data entry errors.
- Use 4–7 points for most audiences; label all points. Scales in this range balance detail and ease of response. Fewer points can feel too limiting, while more than seven may overwhelm respondents or add noise. Clear labels for each point help everyone interpret the scale the same way.
- Avoid combining two ideas in a single question (“price and quality”). If two factors might move in different directions, split them into separate questions. That keeps results reliable and easier to analyze later.
- Add “Not applicable” only when it truly applies. Including this option prevents frustration when a question doesn’t fit a respondent’s experience. Overusing it can encourage skipping and reduce usable data, so limit it to cases where an answer really doesn’t apply.

Take the legwork out of Likert scale questions
Answer Genius helps you quickly build surveys with more confidence—just choose an answer type to automatically add a set of prewritten answer choices to your question.
How to choose your scale points
Your scale points are foundational, as they dictate the level of nuance you can capture and the cognitive burden on your respondents.
This choice involves deciding between odd versus even numbers, and whether to use a bipolar scale or a unipolar scale.
Before deciding, consider the complexity of your topic and your audience's context to find the balance that yields precise, reliable data without sacrificing response quality.
Odd vs. even
- Odd-numbered scales (e.g., 5 or 7 points) include a central, neutral midpoint, which should be used only when a true neutral response is a meaningful and common state for your respondents, thereby preventing them from being forced to select a directional response.
- Even-numbered scales (e.g., 4 or 6 points) intentionally remove the neutral midpoint, creating a forced choice to push respondents to a directional side. This technique must be used carefully to avoid frustrating genuinely neutral individuals and generating inaccurate data.
Unipolar vs. bipolar
- A unipolar scale is used to measure the intensity or amount of a single attribute, typically ranging from a complete absence of the attribute (e.g., "Not at all satisfied") to the highest possible degree of it (e.g., "Extremely satisfied").
- A bipolar scale is used to measure both the direction and intensity of an attitude or feeling, anchored by two opposing extreme labels (like "Strongly disagree" to "Strongly agree") with a meaningful, zero-point midpoint in between.
Research suggests that scale design affects response behavior. The “right” choice depends on your construct and audience.
How many points should your Likert scale have?
Research shows that using 5–7 response points typically provides the best balance of reliability, usability, and clarity. One study found that 7 points can be helpful in certain contexts, while other research found little difference once you’re at 5+. Your tradeoff is granularity vs. respondent fatigue.
Scale picker (quick decisions)
| If your construct is… | Polarity to use | Recommended points | When this shines |
| Agreement when you want to avoid neutral | Bipolar | 4 | Forces a lean when “true neutral” isn’t meaningful or desired |
| Agreement about a statement | Bipolar | 5 or 7 | Attitudes with meaningful neutrality |
| Satisfaction with a service | Unipolar | 5 | Simple, fast read on experience |
| Importance of features | Unipolar | 5 or 6 | Prioritization exercises |
| Likelihood to act | Unipolar | 5 or 7 | Intent questions (e.g., purchase) |
| Frequency of behavior | Unipolar | 5 | Habits and usage |
| Satisfaction for expert audiences who want fine details | Unipolar | 10 | Granularity without jumping to 11 |
| NPS loyalty | Numeric (bipolar direction encoded) | 11 (0–10) | Benchmarkable loyalty tracking |
Tip: If respondents are new to the topic or multitasking on mobile, use 5 labeled points for clearer, faster answers.
8 Likert scale examples
To see the power of the Likert scale in action, we've provided eight effective sample questions that demonstrate how to measure different dimensions of sentiment. These examples cover essential metrics like satisfaction, agreement, importance, and frequency across various scale types.
1. 4-point agreement Likert scale question
This 4-point Likert scale uses a bipolar format to measure the level of agreement with a statement. By excluding a midpoint, it forces respondents to lean toward either agree or disagree, providing clearer directional feedback.
How satisfied or dissatisfied are you with the speed of product delivery?
- Strongly disagree
- Somewhat disagree
- Somewhat agree
- Strongly agree
2. 7-point agreement Likert scale question
This 7-point Likert scale uses a bipolar format to gauge the extent of agreement with a statement, giving respondents a broad range of options from "Strongly disagree" to "Strongly agree." The wider scale allows for high precision in capturing even subtle differences in sentiment.
How much do you agree or disagree that the company helps its employees grow their careers?
- Strongly disagree
- Moderately disagree
- Slightly disagree
- Neither agree nor disagree
- Slightly agree
- Moderately agree
- Strongly agree
3. 5-point satisfaction Likert scale question

This 5-point Likert scale measures customer satisfaction in a unipolar format, with options typically ranging from "Not satisfied at all" to "Extremely satisfied." The structure focuses on expressing the degree to which a respondent experienced an attribute.
How satisfied are you with our service speed?
- Not at all satisfied
- Slightly satisfied
- Moderately satisfied
- Very satisfied
- Extremely satisfied
4. 6-point importance Likert scale question
This 6-point Likert scale measures importance using a unipolar scale, typically ranging from "Not at all important" to "Extremely important." The lack of a midpoint is designed to force prioritization, ensuring respondents clearly indicate how crucial a specific factor is.
How important is service speed to you?
- Not at all important
- Slightly important
- Somewhat important
- Moderately important
- Very important
- Extremely important
5. 5-point likelihood Likert scale
This 5-point Likert scale measures the likelihood of a future action using a unipolar format, where options might range from "Not at all likely" to "Extremely likely." This structure clearly focuses the respondent on the probability of them performing the intended action.
How likely are you to come to a future conference?
- Not at all likely
- Slightly likely
- Moderately likely
- Very likely
- Extremely likely
6. 5-point frequency Likert scale
This 5-point Likert scale measures the frequency of a specific behavior using a unipolar format, typically ranging from options like "Never" to "Always." This structure allows you to quickly quantify how frequently a particular action or event occurs among your respondents.
How often do you use the reporting dashboard?
- Never
- Rarely
- Sometimes
- Often
- Always
7. 10-point satisfaction Likert scale
This 10-point Likert scale measures satisfaction using a unipolar format, fully labeled across all 10 points, often ranging from "Not at all satisfied" to "Extremely satisfied." The extensive range offers high granularity, allowing respondents to make fine distinctions in their level of contentment.
How satisfied are you with our delivery speed, on a scale from 1 to 10, with 1 being the least satisfied, and 10 being the most satisfied?
- 1
- 2
- 3
- 4
- 5
- 6
- 7
- 8
- 9
- 10
8. 11-point NPS scale
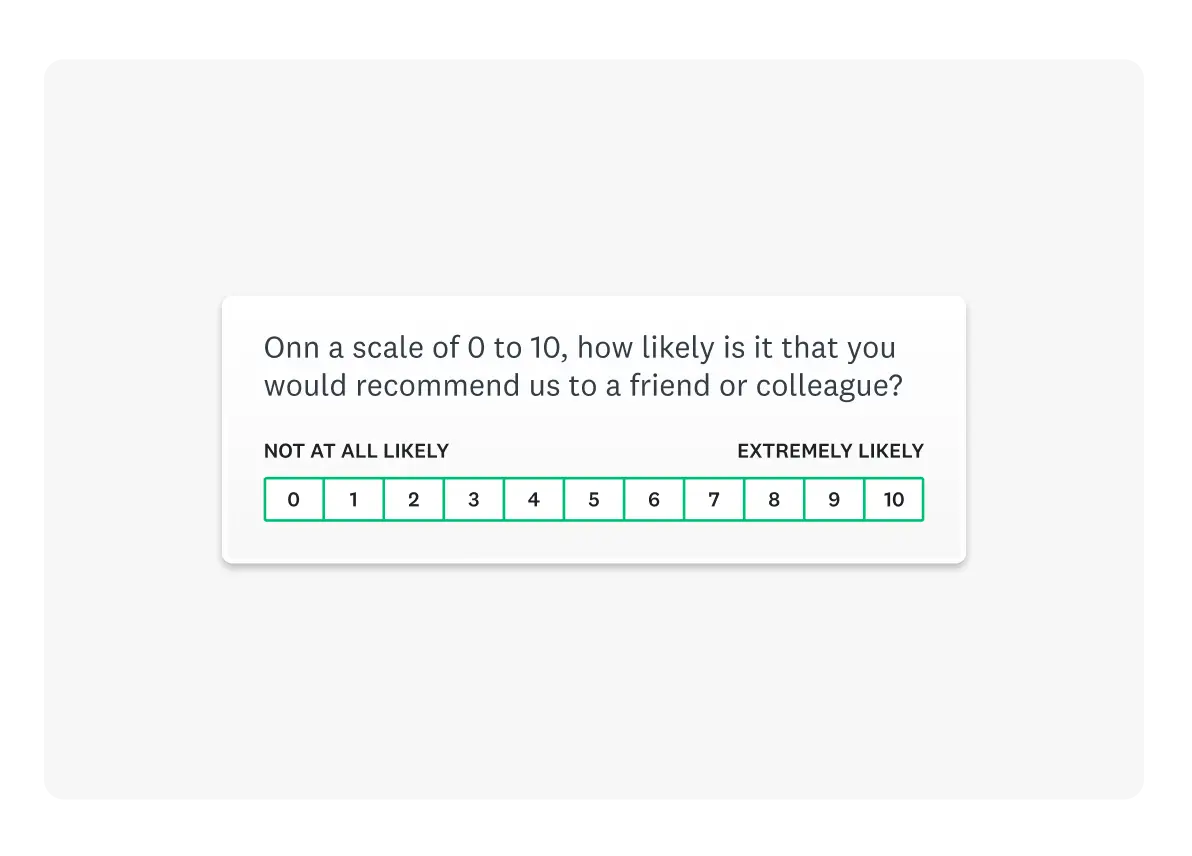
This 11-point numeric scale is the standardized metric for calculating the Net Promoter Score , asking customers to rate their likelihood of recommending a company from 0 ("Not at all likely") to 10 ("Extremely likely").
How likely are you to recommend this company to a friend or colleague?
- 0 — Not at all likely
- 1
- 2
- 3
- 4
- 5
- 6
- 7
- 8
- 9
- 10 — Extremely likely
Once you’ve collected your responses, you can calculate your Net Promoter Score using our free NPS calculator to see your score instantly and compare it to industry benchmarks.
How to analyze and interpret Likert scale data
You've built your Likert scale survey—that's a huge win! However, the subsequent, and arguably more critical, phase involves the rigorous analysis of the resulting data.
This process is essential for accurately quantifying performance and deriving meaningful metrics within the survey's target area.
1. Analyze single items as ordinal data
Individual Likert scale questions must be treated as ordinal data, prioritizing the sequential order of responses over assumed equal intervals.
Begin the analysis by determining the distribution, calculating the raw counts and percentages for each response category.
Visualize this data using a bar chart, ensuring categories are strictly ordered from negative to positive responses to allow readers to immediately discern the shape of the distribution.
2. Utilize non-parametric descriptors
To transform raw data into actionable insights, follow this three-step sequence:
- Analyze the distribution: Start by looking at the full frequency distribution. Since Likert data is ordinal, this shows you exactly how many respondents fall into each category, revealing if your data is skewed or polarized.
- Calculate central tendency: Determine the median and the mode. These are the most robust measures for ordinal data. If your scale is symmetric and your audience requires a single "roll-up" number, you may report the Mean as an approximation, provided you acknowledge the data's ordinal nature.
- Combine into buckets: Simplify the reporting by grouping responses into "Top 2 Box" (Positive), "Neutral," and "Bottom 2 Box" (Negative) categories.
To quantify the dispersion of responses, include the Interquartile Range (IQR). This offers a robust measure of variability that demonstrates how spread out the answers are while excluding outliers.
Unlike standard deviation, which assumes a normal distribution, the IQR is better suited for the "steps" of a Likert scale.
Once you have the high-level summary, go deeper by filtering and comparing responses between specific groups. This allows you to identify if sentiment shifts based on secondary variables, such as:
- Demographics: How do responses differ by Age, Gender, or Income?
- Behavioral data: Do frequent users rate the service higher than occasional users?
- Geographic data: Are there specific locations or regions driving the "Bottom 2 Box" scores?
By cross-tabulating your Likert "buckets" against these variables, you can move from simply describing what happened to understanding who is driving those results.
3. Strategically collapse response categories
For clearer communication and executive summaries, collapse the original Likert categories into broader, more manageable groups. In market research, this is commonly referred to using top box terminology:
- Top 2 Box (T2B): The combined percentage of the two most positive responses (e.g., "Strongly agree" and "Agree"). This is the gold standard for measuring overall satisfaction or agreement.
- Top Box: Refers exclusively to the single highest rating (e.g., "Strongly agree"). High-performing brands often track this to measure "true fans" or brand advocates.
- Bottom 2 Box (B2B): The combined percentage of the two most negative responses (e.g., "Strongly disagree" and "Disagree"), used to identify friction points.
A common and highly effective method is to create three macro-categories: positive, neutral, and negative. This is achieved by grouping the Top 2 Boxes and the Bottom 2 Boxes while leaving the middle option as a standalone neutral marker.
This process simplifies reporting, highlights overall sentiment direction, and is particularly useful for trend tracking over time.
4. Visuals that work
Choosing the right survey chart type allows stakeholders to quickly grasp both the "big picture" and the underlying details. Common charts include:
- Vertical bar chart
- Horizontal bar chart
- Pie chart
- Line chart
- Scatter plot
- Histogram
5 common Likert scale pitfalls and quick fixes
Even well-designed Likert scales can suffer from systematic errors that compromise data quality. Identifying and correcting these issues is crucial for ensuring your survey results accurately reflect reality. Below are five common pitfalls and their corresponding, effective fixes.
1. Midpoint overuse
The midpoint (e.g., "Neither agree nor disagree") can dominate responses if the item is not relevant or if respondents are simply avoiding a definitive answer. High use of the midpoint can obscure true sentiment.
Quick fix:
- Verify relevance: Confirm the item is meaningful to the respondent group.
- Refine wording: Tighten the phrasing to ensure clarity.
- Even-point scale: Consider using an even-point scale (e.g., 4 or 6 points) when you suspect genuine neutrality is rare or when you need respondents to lean one way or the other.
2. Ambiguous labels
Vague or poorly differentiated labels, such as "Good" versus "Great," make it difficult for respondents to select the most appropriate category, introducing measurement error.
Quick fix:
Use fully labeled, concrete steps that provide clear semantic distinctions (e.g., "Slightly satisfied," "Moderately satisfied," "Very satisfied," "Extremely satisfied"). Research consistently demonstrates that complete labeling improves the scale's measurement properties.
3. Double-barreled items
A double-barreled item attempts to measure two distinct concepts within a single question (e.g., "The price was fair and the quality was high"). A respondent who agrees with one concept but disagrees with the other cannot answer accurately.
Quick fix:
Split the question into two separate, distinct items: one addressing the first concept (price) and another addressing the second (quality).
4. Polarity flips mid-survey
Inconsistency in the response order—where the scale suddenly flips from "Low → High" to "High → Low" (e.g., "Strongly disagree" on the left, then "Strongly agree" on the left later on)—is confusing and a major source of measurement error.
Quick fix:
Maintain consistent polarity throughout the entire survey (e.g., always place the negative end on the left). If a shift is absolutely necessary (e.g., for certain reverse-coded items), add a short instructional note to warn the respondent of the change.
5. Social desirability bias
This bias occurs when respondents deliberately overreport attitudes they believe are socially favorable or expected, particularly for sensitive topics.
Quick fix:
- Anonymity assurance: Add reassuring language early in the survey emphasizing confidentiality and anonymity.
- Skip logic: Employ branching or skip logic so sensitive follow-up questions only appear after a general, non-threatening initial response, reducing the psychological pressure on the respondent.
Build Likert scale surveys in SurveyMonkey
- Answer Genius → prewritten answer sets. Start typing your question and let SurveyMonkey recommend the right question type and add balanced answer options instantly. It’s available as part of our AI features.
- Question & skip logic → ask only what matters. Use logic to branch to follow-ups when respondents choose certain options. This will speed up your survey and improve data quality.
- Next steps: Get started free or compare plans to access advanced analysis and collaboration.
Turn Likert scale data into confident, research-ready insights
Likert scales turn fuzzy opinions into clear signals when you pick the right polarity and point count, write precise questions, and summarize the distribution, not just the average. They’re one of the most versatile tools in research and feedback collection. Whether you’re designing a 5-point satisfaction Likert scale or a 10-point confidence Likert scale, understanding how to formulate questions, analyze data, and interpret results ensures your insights are both reliable and actionable.
With SurveyMonkey, you can start with expert answer sets, avoid common pitfalls, and make confident decisions faster. Answer Genius helps you build polished Likert questions in seconds, so you can focus on insights, not setup. Explore our resources, including guides on creating strong CSAT surveys, NPS, and employee engagement templates, or sign up for free to launch your next survey.
Discover more resources

Solutions for your role
SurveyMonkey can help you do your job better. Discover how to make a bigger impact with winning strategies, products, experiences, and more.

Travel survey questions: 40+ examples to improve guest and traveler feedback
Use these 40+ travel survey questions and templates to collect feedback, boost guest satisfaction, and improve every traveller’s experience.

When you need to ask follow-up questions
Follow-up questions are a great tool to gather more insightful, specific data from surveys. Here's how and when you need to ask follow up questions.

The pros and cons of survey prizes
Explore the pros and cons of offering survey prizes, assess whether you need them, and learn best practices for using survey incentives effectively.
Create and send a survey for free in minutes
Use SurveyMonkey's survey templates and get the feedback you need.
NPS, Net Promoter & Net Promoter Score are registered trademarks of Satmetrix Systems, Inc., Bain & Company and Fred Reichheld.