Customer effort score (CES): what it is and how to use it
Learn what Customer Effort Score (CES) is, how to measure it, and how to improve customer satisfaction.

Imagine trying to return a faulty product, but the process is confusing, slow, and frustrating. Would you buy from that company again? Probably not. That’s where customer effort score (CES) comes in—a powerful metric that reveals how easy (or difficult) it is for customers to interact with your business.
Companies with lower effort scores enjoy higher customer satisfaction, increased loyalty, and stronger customer retention rates. Gartner research even suggests that 94% of customers with low-effort interactions are more likely to repurchase, while 88% will increase their spending.
In this guide, we’ll explain CES, how to measure it, and share key strategies for improving it. We’ll also review example questions to include in your CES survey for more valuable insights.
TL;DR
- Customer effort score measures how easily customers interact with your company through support, purchases, and other touchpoints.
- You can track CES with a customer effort score survey, where respondents rate their ease of interaction.
- A good CES is under 3 on a 1–5 or 1–7 scale, indicating easier customer interactions.
- Reducing your CES boosts customer satisfaction, loyalty, and revenue, as customers prefer companies that offer seamless experiences.
What is customer effort score (CES)?
Customer effort score (CES) is a customer experience (CX) metric that measures the effort customers spend resolving issues, making purchases, or receiving support. CX pros track CES to identify friction points in the customer journey and close customer experience gaps.
Lower CES suggests easier interactions. For example, low support-related CES highlights strong customer service interactions that solve problems quickly. Consistently high CES in the checkout process indicates barriers like complex payment options or slow processing.
Customers who have to work hard to interact with your company are more likely to switch to competitors. Tracking and reducing your customer effort score over time can directly impact retention and long-term revenue, making it a critical factor in a company’s success.
How do you calculate the customer effort score?
Determine your CES score by using CES surveys to collect responses from customers who have recently interacted with your company.
In these surveys, customers are typically asked, "On a scale of 1–5, how easy was it to resolve your issue?" Lower scores indicate less effort, and higher scores suggest greater difficulty.
To calculate CES, divide the total sum of all survey responses by the number of respondents.
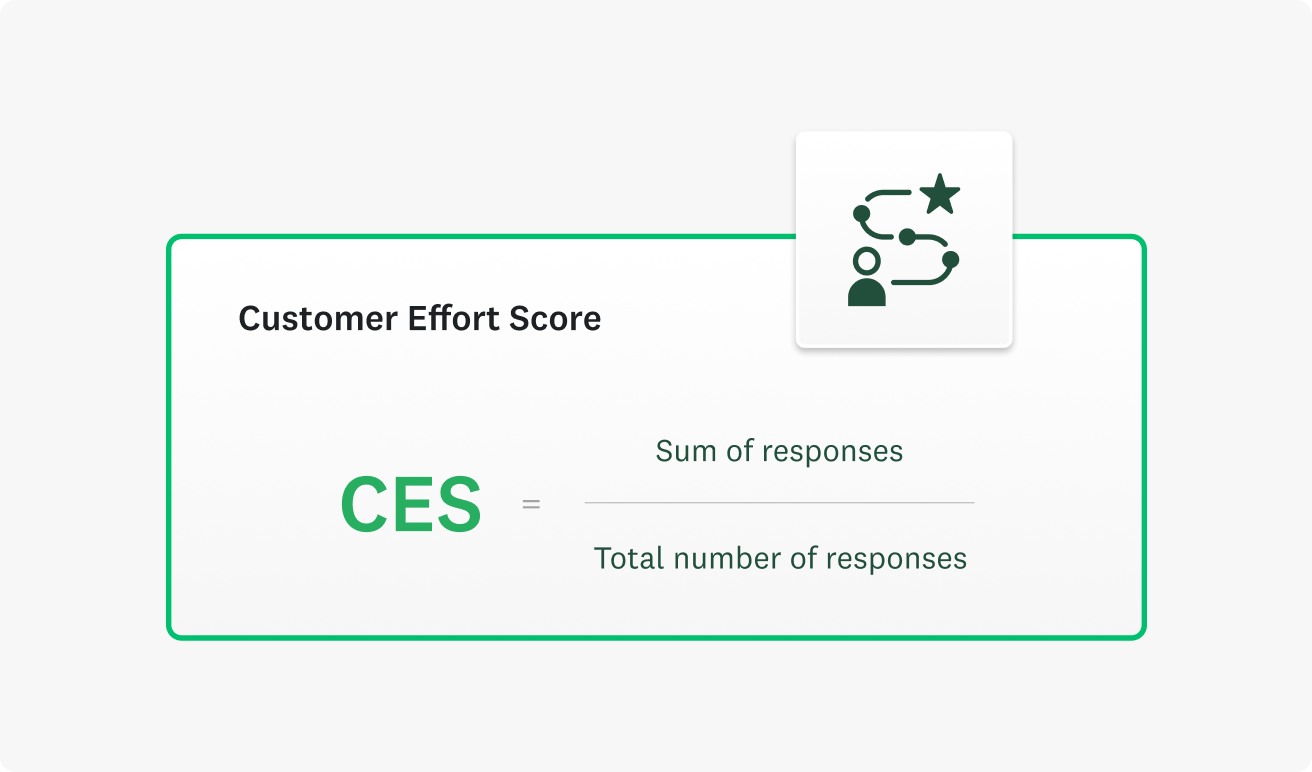
CES = Total sum of customer effort ratings ÷ total number of respondents
For example, if 500 customers rate your company at a 5, the total sum of their responses is 2500 (500 * 5), and your CES score would be 5 (2,500 ÷ 500).
Related reading: Measuring customer experience
How does customer effort score (CES) help your business?
CES is more than just a metric; it directly indicates how effectively your company meets customer needs. When customers experience minimal effort in their interactions, they are more likely to have a positive perception of your brand, leading to long-term benefits for your business.
A lower CES can help you:
- Increase customer loyalty: Customers who experience effortless interactions are more likely to return and continue engaging with your brand over the long term.
- Identify operational friction: CES pinpoints areas where customers struggle, allowing businesses to address inefficiencies and improve service delivery.
- Reduce customer churn: Frustrated customers leave, while satisfied customers stay and even advocate for a brand through referrals and positive reviews.
- Drive revenue growth: A smooth experience encourages repeat purchases, higher conversion rates, and increased customer lifetime value.
- Boost brand reputation: Positive experiences lead to word-of-mouth recommendations, strengthening a company’s position in the market.
Related reading: Why you should care about customer effort score (CES)
What is a good customer effort score?
CES surveys prompt customers to rate interactions on a scale of 1–5 or 1–7, where lower scores indicate minimal effort:
- 1–2 (Excellent): Customers experience almost no friction, meaning their interactions are smooth, efficient, and hassle-free. Companies with this score offer exceptional customer experiences, reducing frustration and enabling quick, easy actions.
- 3 (Acceptable): Some effort is required, but the process is still manageable and does not significantly impact the customer’s overall satisfaction. Customers may have faced minor issues, such as a complex checkout, hold times, or unclear product features.
- 4–5 (Needs improvement): Customers find the experience frustrating and may reconsider doing business with the company if the effort remains high. These CES scores indicate customer frustration, usually due to delays, confusion, or complicated workflows.
- Above 5 (High effort): Customers struggle to complete their desired actions. High effort experiences lead to frustration, abandonment, and ultimately, loss of customers to competitors.
A good CES is typically below 3, indicating minimal customer effort and a streamlined experience.
When to use customer effort score (CES)
Your score and survey responses highlight where your company excels in customer satisfaction and areas where you can improve customer experiences.
Send a CES survey at key moments in the customer journey when you need to assess the ease or difficulty of an interaction.
After customer support interactions
When customers seek help via phone, email, or chat, it’s important to know whether the process was simple or frustrating. Measuring CES after support interactions highlights customer service inefficiencies, such as long wait times, unclear responses, and unresolved issues.
Use this data to refine support workflows, train agents more effectively, and introduce self-service options that make it easier for customers to resolve issues independently.
Following a purchase or transaction
Purchasing a product or subscribing to a service should be a seamless process. Customers may abandon purchases if the checkout process is complex, pricing is unclear, or payment fails.
Measuring CES post-transaction helps businesses assess the efficiency of their sales funnel and make adjustments to checkout flow, payment security, and product accessibility.
During onboarding processes
A smooth onboarding process is essential for customer engagement with a product or service. If customers struggle to use a platform, set up an account, or navigate features, they may quickly become frustrated and stop using it.
Measuring CES during onboarding provides insight into whether the experience is intuitive or if additional guidance, tutorials, or customer support is required to reduce friction.
After using self-service options
Many businesses offer self-service tools, such as FAQs, knowledge bases, and AI chatbots, to help customers find solutions without live support. While convenient, these options must be user-friendly.
Evaluating CES following a customer's use of a self-service feature helps assess whether the tool successfully addresses issues or if your customers need enhancements, like better search options or clearer guidelines.
When renewing or upgrading services
Subscription-based companies offering tiered service plans should facilitate renewal and upgrade processes. If it’s too difficult to renew a subscription or upgrade a plan due to complicated terms, unexpected costs, or unclear instructions, customers may choose not to continue with your service.
Tracking CES at these points allows companies to simplify workflows and improve transparency.
After addressing specific pain points
Companies often implement changes based on customer feedback to remove friction from the customer experience. However, it’s important to measure the impact of those changes to see if they actually reduce effort.
By tracking CES before and after making adjustments, you can determine whether your updates have successfully improved customer experience or need further improvement.
How to use the customer effort score
Use your CES to improve the key interactions listed above continuously. By making incremental changes that reduce friction at each customer touchpoint, you can lower your CES and provide a better customer experience over time.
Step 1: Design the survey
CES surveys should be concise, targeted, and easy to understand. The target question should focus on how easy or difficult it was for the customer to complete a specific action, like resolving an issue, making a purchase, or navigating a service.
Include open-ended questions to encourage customers to elaborate on any challenges they encountered. These responses will add context to your score and highlight specific pain points to address.
Step 2: Choose the right timing
Timing plays a crucial role in collecting accurate CES data. Send your CES survey immediately after a customer interaction to ensure that feedback reflects the experience accurately.
For example, trigger an automated CES survey after a customer support call to ask about the resolution process. Waiting too long to send your survey might lead to inaccurate responses, as customers may not recall details as clearly.
Step 3: Collect responses
Use multiple channels to distribute surveys, including email, SMS, website pop-ups, and mobile app notifications. Offering an incentive, such as a discount or entry into a giveaway, can increase response rates.
Make sure your CES surveys are mobile-friendly, so you can reach a broader audience.
Step 4: Calculate the CES score
Once responses are collected, calculate your CES by dividing the sum of the ratings by the number of responses.
Step 5: Analyze feedback
Raw CES data provides a general sense of customer effort, but deeper insights come from analyzing response patterns.
Segment your results by interaction type (e.g., support, checkout, onboarding) to identify specific areas of difficulty. Review open-ended responses to collect qualitative data that might not be evident from your numerical score.
Step 6: Act on insights
Continuous iteration based on CES insights can help you build a progressively better customer experience. If customer support interactions receive poor scores, additional training or AI-powered chatbots may be needed to enhance resolution efficiency.
Step 7: Track over time
CES is not a one-time measurement; it should be tracked consistently over time to gauge improvements. Establishing a CES benchmark allows businesses to monitor whether efforts to reduce friction are working. Businesses should set periodic review cycles—monthly or quarterly—to assess trends and ensure that progress is being made toward lowering customer effort.
Step 8: Integrate CES data
Linking CES data with other customer experience metrics, such as Net Promoter Score (NPS®) and Customer Satisfaction Score (CSAT), provides a comprehensive view of customer interactions.
Additionally, sharing CES findings across departments—such as customer service, product development, and marketing—ensures that every team plays a role in enhancing customer experiences.
How to measure customer effort score effectively
Measuring CES effectively requires a structured approach that ensures accuracy and delivers actionable insights. By carefully defining the scope of measurement, crafting clear survey questions, and analyzing responses at the right time, businesses can leverage CES to enhance customer experiences and reduce friction across key touchpoints. The following steps outline the best practices for measuring CES.
Additional metrics that complement CES include:
- Customer Satisfaction Score (CSAT): Measures overall customer satisfaction with an experience, often used in tandem with CES.
- Net Promoter Score (NPS): Assesses how likely a customer is to recommend a company, indirectly reflecting ease of experience.
- Retention and churn Rates: CES can help predict customer retention trends, as high effort often correlates with higher churn.
Define customer interactions
The first step in measuring CES is identifying the key interactions that directly impact customer satisfaction. Focus on moments where customer effort is most critical, such as:
- Making a purchase online or in-store
- Contacting customer support for issue resolution
- Navigating a website or mobile app
- Using self-service resources, such as FAQs or AI chatbots
- Completing onboarding or account setup processes
Clearly defining these interactions ensures that your CES surveys target the most impactful areas and provide meaningful insights.
Create clear customer effort score survey questions
Well-designed CES surveys ask straightforward, specific questions to gauge effort. The primary question should be direct and easy to understand, such as:
- "How easy was it to resolve your issue with our support team?"
- "How much effort did you have to put into completing your purchase?"
- "Did using our self-service portal help you find what you needed with minimal effort?"
Avoid leading or ambiguous questions that could influence responses. Additionally, providing an open-ended follow-up question allows customers to elaborate on their ratings, offering deeper insights into pain points.
Choose the right scale
The scale used in CES surveys significantly impacts data interpretation. The two most common CES rating scales are:
- 1–5 scale ranges from Very Easy (1) to Very Difficult (5), offering a broad yet simple measure of effort.
- 1–7 scale provides a more detailed response spectrum, capturing subtle differences in customer experiences.
Selecting a consistent scale helps businesses track trends over time and compare performance across different interactions.
Use a variety of survey distribution channels
For accurate results, CES surveys should be sent immediately after a customer interaction while the experience is still recent. Surveys can be distributed through multiple channels, including:
- Email: Ideal for follow-ups after online purchases, customer service interactions, or onboarding.
- In-app or website pop-ups: Best for measuring effort related to digital experiences, such as browsing or account setup.
- SMS notifications: Useful for quick post-service feedback, particularly for mobile-centric businesses.
Ensure that surveys are short, accessible, and mobile-friendly to increase response rates and boost data reliability.
Ensure timing is appropriate
The timing of CES surveys can make or break their effectiveness. Sending surveys too soon may result in incomplete feedback, while delays can lead to distorted memories of the interaction. Businesses should deploy surveys:
- Immediately after a customer service call or chat session
- Shortly after a transaction or checkout process is completed
- After a customer has used a self-service tool, like a knowledge base or chatbot
- Upon completion of an onboarding process or tutorial
By capturing feedback at the right moment, companies can accurately measure customer effort and identify opportunities for improvement.
Example of customer effort score questions
Businesses must use varied CES survey questions to gather comprehensive feedback. To help you design an effective survey, we will share questions for three categories of CES surveys.
Post-purchase
CES surveys are useful for asking questions about the purchase process and transaction ease. You may ask:
- How easy was it to complete your transaction today?
- Did you encounter any delays in completing your transaction?
- How satisfied were you with the available payment options?
- Did you feel the purchase process was secure and trustworthy?
- How simple was it to apply promo codes, discounts, or coupons?
Support interaction questions
Post-support interaction CES surveys measure the effort involved after a customer service interaction. Ask questions like:
- How easy was it to get your issue resolved?
- Were you able to connect with a customer service representative quickly?
- Based on this experience, how likely are you to use our support services in the future?
- How clear and helpful was the customer service representative?
- How easy was it to find the support/resources you needed?
Onboarding
CES surveys can also measure the onboarding experience for new products or services your business offers. Measure customer effort by asking:
- How easy was it to understand the setup instructions?
- Did you encounter any challenges during the onboarding process?
- How confident do you feel using the product after the onboarding process?
- How effortless was it to contact support if you had questions during onboarding?
- How quickly did you get the product up and running?
Tips to improve customer effort score
Here are actionable ways to enhance CES and create effortless customer experiences:
Streamlining customer touchpoints
Analyze the entire customer journey and remove unnecessary obstacles. Optimizing your website for a smoother checkout experience, simplifying customer support workflows, and providing customer service faster can all help lower your CES over time.
Providing proactive customer support
A well-informed customer is less likely to experience frustration. Instead of waiting for customers to seek assistance, anticipate challenges and provide solutions proactively.
Offer automated help guides, chatbots that address frequently asked questions, and send proactive email notifications that tackle common pain points.
Reducing response times
Customers expect quick resolutions to their issues. Slow response times result in increased frustration and higher effort. Businesses should invest in AI-driven customer support tools, well-trained support agents, and live chat features that provide immediate assistance. The faster an issue is resolved, the better the customer’s experience will be.
Offering self-service options
Many customers prefer to solve issues independently rather than contact customer support. Providing a comprehensive knowledge base and FAQ section encourages customers to find the information they need without unnecessary effort.
CES (Customer Effort Score) vs. other CX metrics
CES is frequently compared to other customer experience (CX) metrics like NPS and Customer CSAT. Although each metric offers valuable insights, they play different roles and should be utilized strategically.
CES vs. NPS (Net Promoter Score)
NPS measures how likely a customer is to recommend a business, while CES highlights the ease of an interaction. Use CES to assess specific interactions and NPS to track brand perception and loyalty.
CES vs. CSAT (Customer Satisfaction Score)
CSAT measures customers' satisfaction with an interaction, but it does not indicate whether the process was easy or frustrating. CES specifically pinpoints the level of effort required, making it a more actionable metric when businesses want to reduce friction.
Use CES when evaluating service efficiency, ease of purchasing, or onboarding effectiveness. Pairing CES with NPS and CSAT provides a complete picture of customer sentiment and experience quality.
Improve your customer effort score with SurveyMonkey
SurveyMonkey provides the tools needed to measure and improve CES efficiently. With a customizable CES survey template, automated response tracking, and in-depth analytics, you can gain valuable insights into customer effort and take action to improve interactions at every stage.
Discover more resources

Customer satisfaction survey templates
Explore our customer satisfaction survey templates to rapidly collect data, identify pain points, and improve your customer experience.

The ultimate customer satisfaction guide: how to measure & strategies for success
What is customer satisfaction? Learn what it is, how to measure customer satisfaction, and 8 strategies for business success with this complete guide.

State of Surveys: Top trends and best practices for 2025
Watch this webinar to explore 2025 survey trends, mobile insights, and best practices for optimizing your survey strategy.

See how Ryanair collects customer insights at scale
Discover how Ryanair uses SurveyMonkey and its Microsoft Power BI integration to track 500K monthly CSAT surveys and improve customer experiences.
Ready to get started?
Net Promoter, Net Promoter Score, and NPS are trademarks of Satmetrix Systems, Inc., Bain & Company, Inc., and Fred Reichheld.