3 types of survey research: Exploratory, descriptive, and causal (with examples)
Discover when to use exploratory, descriptive, or causal survey research to ask smarter questions and get more reliable answers.

The right survey design turns curiosity into clear insight. Whether you’re exploring an open question, measuring what’s true for a defined group, or testing whether one change drives another, each type of survey research has a distinct purpose.
This guide walks through exploratory, descriptive, and causal surveys: how they work, when to use them, and what each reveals. Along the way, you’ll find examples, pitfalls to avoid, and in-platform tools to help you move from ideas to evidence with confidence.
3 types of survey research
Surveys are one of the most flexible and widely used research methods. Whether you’re exploring new ideas, measuring what’s true for a group, or testing how one change affects another, survey research helps you turn questions into data. High-quality quantitative and qualitative data lead to meaningful insights.
The three core types are exploratory, descriptive, and causal. Each serves a distinct purpose. Together, they form a toolkit for discovering insights, quantifying patterns, and validating cause-and-effect relationships. Understanding when and how to use each design is key to getting reliable, actionable results.
1. Exploratory research surveys
Exploratory survey research methods help you learn fast in early stages when you're not ready to lock variables or scales. It leans qualitative and uses small, purpose-driven samples to surface themes, hypotheses, and the language your audience uses. This early discovery makes later structured studies sharper. In research methods, exploration is the design phase that helps you generate ideas and clarify what to measure next.
When to use the exploratory method
- To understand what problems exist and how people talk about them.
- To identify candidate variables, attributes, and response options for future surveys.
- To surface unknowns before you invest in a larger, generalizable study.
Exploratory question styles
Use open-ended prompts, flexible probes, and short sequences that encourage storytelling. Ask, “What made you choose that?” or “Walk me through the last time you . . ?” Then, once themes stabilize, translate key concepts into scalable items.
Exploratory research example
Your team’s engagement scores have dipped, and you suspect staffing or workload might be to blame, but you’re not sure. Instead of guessing, you run an exploratory pulse survey to hear what employees actually experience day to day.

You start with open-ended questions like:
- “What aspects of your job do you find most rewarding?”
- “Which parts feel most challenging or frustrating?”
The feedback surprises you. Employees say the extra responsibilities aren’t the issue—they appreciate the growth opportunities. What’s really driving frustration is longer commutes after new shift schedules and unclear pay policies.

While these insights aren’t statistically representative, they give you clear direction. You refine the problem statement, design a follow-up benefits and scheduling survey, and track satisfaction over time. The result: focused questions, faster fixes, and engagement data you can act on.
What exploratory research tells you
Exploratory results aren't statistically generalizable, but they are actionable. They reframe the problem and give you candidate variables (commute time, schedule flexibility, pay clarity) to measure next.
Pitfalls to watch
- Treating exploratory data like population estimates
- Letting leading wording or moderator effects steer answers
- Skipping documentation of sampling and coding methods for follow-up studies
Exploratory next steps with Survey Monkey
- Begin with open-ended templates, then refine into scaled items.
- Use light screeners to reach the right internal audiences.
2. Descriptive research surveys
Descriptive survey research measures the who, what, how often, and how much for a defined population, typically in a cross-sectional snapshot. You'll use closed-ended items (multiple choice, Likert, semantic differentials) with pre-coded answers, so results can be summarized and compared. With an adequate sample, findings can be generalized to your target group within a known margin of error.
When to use the descriptive method
- To size demand, awareness, or satisfaction levels
- To describe behaviors and segments (e.g., heavy vs. light users)
- To benchmark metrics over time with repeated cross-sections
Descriptive question styles
Write clear, single-concept questions with complete answers that don’t overlap or leave gaps. Mix 5- or 7-point scale questions with multiple-choice items so you can compare results across groups.
Descriptive research example
You’ve developed a product prototype and want to understand which audience it resonates with most. To test appeal, you field a descriptive survey to a statistically valid sample of your target population through an online research panel.
Respondents see a brief concept description and answer structured questions such as:
- “How appealing do you find this product?”
- “How likely would you be to try it?”
- “What would make you more or less likely to buy it?”
When the data comes in, 28% of all respondents say the product meets a need that isn’t currently being fulfilled. You then segment results by demographics (age, income, and location) and discover that 77% of those aged 35–54 share that sentiment.

That insight reframes your go-to-market plan. Instead of targeting broadly, your team focuses messaging, pricing, and placement around the 35–54 segment that shows the strongest demand. The outcome: data-backed positioning and higher confidence in launch strategy.
Pitfalls to watch
- Too many topics in one survey, causing drop-off and unclear results
- Over-generalizing when the margin of error is wide
- Flat scales with no midpoint or uneven wording
Descriptive next steps in SurveyMonkey
- Use SurveyMonkey Audience to find qualified respondents and set your targeting criteria.
- Keep surveys short and logical with skip or branch logic and randomization, then use auto-analysis and crosstabs to explore subgroup differences.
3. Causal research surveys
Causal survey research design tests whether a change (the treatment) affects an outcome compared with a control. You’ll run structured experiments with random assignment, keep conditions consistent across groups, and analyze differences using significance tests. It helps you answer questions like, “Does this offer increase loyalty?” rather than “What is loyalty right now?”
When to use the causal method
- To see if a change in messaging, price, onboarding, or policy moves a KPI
- To validate an insight before a broad rollout
Causal example
You want to know whether a small gesture from customer service can increase loyalty. To test the impact, you design a causal experiment instead of making a full program change.
Every fifth customer who contacts support is randomly assigned to a treatment group that receives a 20% discount code for their next purchase. The message follows a short script that thanks them for their time and reinforces how much the company values their business. All other customers form the control group and receive standard service.
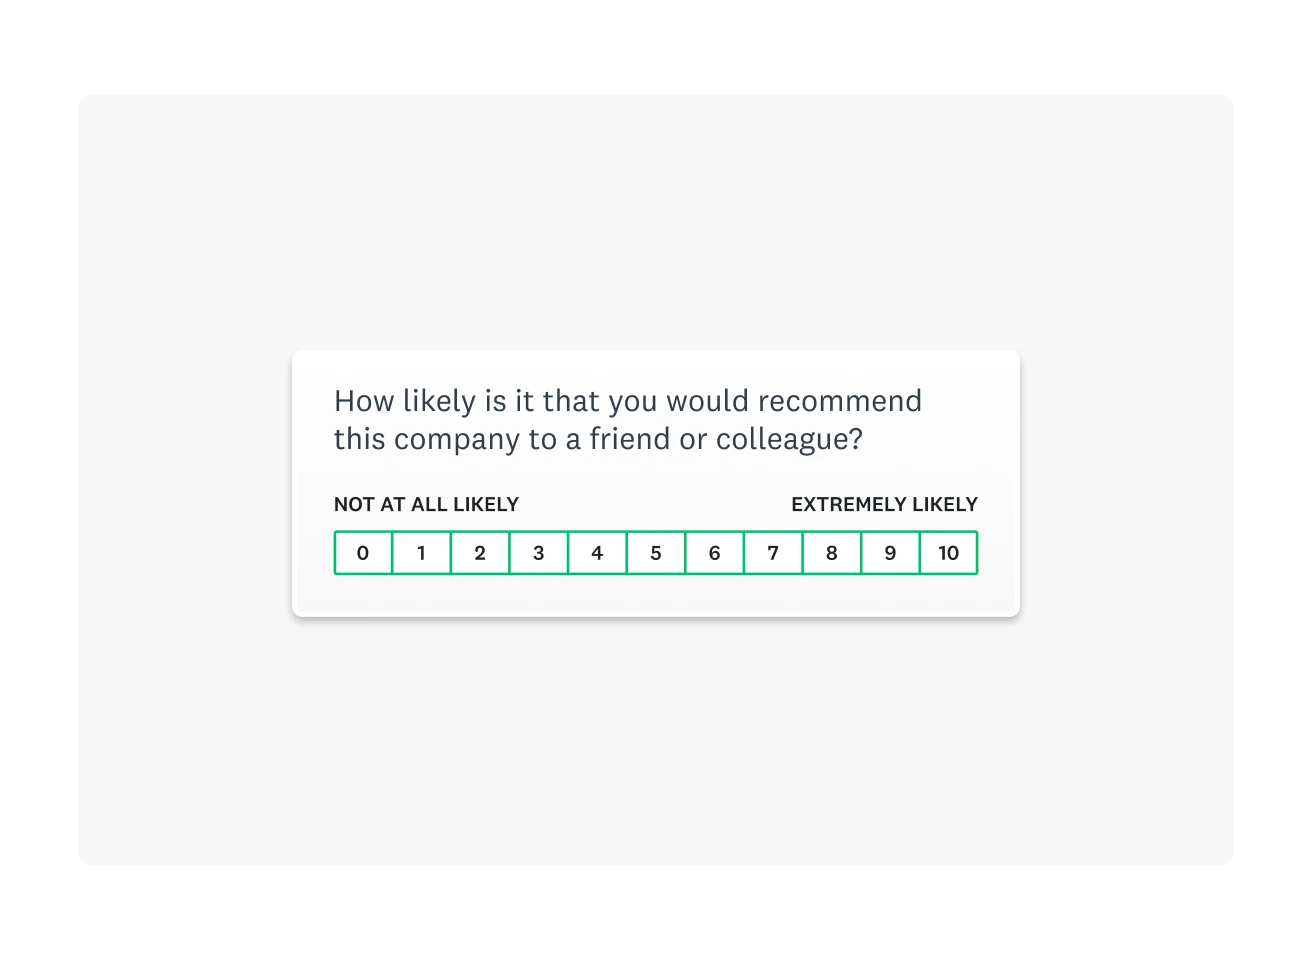
Both groups complete the same post-interaction survey that measures satisfaction, repeat-purchase intent, and Net Promoter Score (NPS®)—the question, “How likely are you to recommend this company to a friend or colleague?”
After several weeks, you compare the results. The treatment group’s loyalty metrics rise significantly above those of the control group, showing that a simple token of appreciation meaningfully boosts retention.
Causal design tips
- Randomize assignment and keep the experience identical across groups except for the treatment.
- Pre-register your hypotheses and decision rules to minimize hindsight bias.
- Estimate your sample size early so you have enough responses to notice meaningful effects.
- Check results with our A/B significance calculator before calling a winner.
Pitfalls to watch
- Confounding variables such as seasonality or contamination between groups
- Tests with too few respondents to detect real effects
- Overinterpreting a single run without replication
Side-by-side comparison of survey research types
This quick overview shows how the three research types differ in practice. It gives you a quick way to confirm which approach fits your goal, what to watch for as you design your study, and where to go next if you want templates, calculators, or more targeted respondents.
| Goal | Typical questions | Data type | Sample needs | Common pitfalls | Next step links |
| Exploratory | What might be driving the issue? Which themes or hypotheses should we test? | Qualitative-heavy (open text), small purpose-driven samples | Smaller, targeted, often non-probability | Overgeneralizing rich quotes; wording or moderator bias | Start with open-ended templates; move to Likert scales once themes stabilize. |
| Descriptive | What's the prevalence, frequency, or average among this group? | Structured, quantitative (multiple choice, Likert) | Right-sized sample; track error | Cramming too many topics; generalizing with high error; flat scales | Size your study with the sample size calculator and interpret precision with the margin of error calculator. |
| Causal | Does X change Y compared with a control? | Experimental; randomized treatments | Adequate power; random assignment; clear control | Confounds; contamination; underpowered tests | Define control vs. treatment; pre-register design; check results with our A/B significance calculator. |
How to choose your survey type
Each survey type fits a different research need. Clarify what you’re trying to learn, then use these prompts to see which one aligns with your question
- Are you exploring a problem space with limited prior knowledge, and you don't know yet which variables to measure? — Exploratory
- Do you need to measure and summarize what's true for a defined group at a point in time? — Descriptive
- Do you need to test cause → effect under controlled conditions? — Causal
Ways to field your survey (pros, cons, and best practices)
Choosing how to field your survey matters as much as the questions you ask. Each survey research method comes with its own strengths, tradeoffs, and best practices.
Below are four of the most common survey methods and when to use each.
1. Online surveys
Online surveys are the most popular and flexible method for collecting feedback. Respondents can answer on any device, at any time—no scheduling required.
Pros: Fast, scalable, and cost-effective; supports multimedia, skip logic, and instant analysis.
Cons: Results can skew if you only recruit from owned channels (like email lists or social media followers).
Best practices:
- Use balanced sampling to avoid bias. Recruit beyond your own network with SurveyMonkey Audience for a more representative view.
- Offer anonymous responses to encourage honest feedback.
- Keep your survey short and relevant with survey logic to skip non-applicable questions.
- Start fast with ready-made survey templates you can customize for your goals.
- Analyze results automatically using SurveyMonkey’s analysis features to uncover hidden patterns and generate reports instantly.
2. In-person surveys
In-person surveys are ideal when you need context or rich qualitative detail. Researchers can observe reactions, ask probing questions, and gather nuanced insights that numbers alone might miss.
Pros: High engagement and contextual feedback; ideal for exploratory research and concept testing.
Cons: Time-intensive; smaller, nonrandom samples; possible interviewer bias.
Best practices:
- Train interviewers to use neutral wording and active listening.
- Document coding rules to ensure consistent interpretation of open-ended responses.
- Combine in-person sessions with online follow-ups for a fuller view.
3. Phone surveys
Phone surveys remain useful for reaching participants who may not respond online or where direct conversation adds value—such as customer experience follow-ups or political polling.
Pros: Enables deeper discussion and clarification; useful for harder-to-reach or specialized audiences.
Cons: Rising nonresponse rates; potential social desirability bias; transcription errors.
Best practices:
- Keep scripts short and conversational.
- Use standardized introductions and tone to reduce interviewer influence.
- Record and verify data entry to minimize errors.
4. Paper surveys
Paper surveys can still play a role in low-connectivity environments or in-person research sessions. They’re often used at events, classrooms, or facilities where digital access is limited.
Pros: Works offline; simple for participants who prefer or require non-digital options.
Cons: Manual data entry is time-consuming and prone to error; lacks logic and automation.
Best practices:
- Digitize responses promptly and perform quality checks.
- Limit open-ended questions to reduce transcription time.
- Transition to digital formats when possible to save cost and improve sustainability.
Choosing your survey research method
No single method fits every study. Online surveys offer speed and scale, while in-person and phone options deepen understanding. Paper formats fill gaps where connectivity or access is limited.
Whichever approach you choose, use SurveyMonkey’s features and global Audience panel to reach verified respondents, apply sound sampling practices, and turn responses into reliable insights.
8 steps to better research surveys
Your results are only as strong as your survey design. A clear goal, thoughtful structure, and sound sampling plan help ensure your data is valid and actionable. Whether you are running exploratory, descriptive, or causal research, these steps can help every type of survey yield reliable results.
1. Clarify the decision
Start with the end in mind. Write one sentence that describes what your team will do with the results. This helps you focus your questions and avoid covering too many topics or testing multiple hypotheses in one survey. Learn more in this guide to survey design.
2. Define the population
Decide exactly who you need responses from and how you will reach them. Consider the types of sampling that best fit your study. The size and characteristics of your sample should mirror those of your target population.
3. Right-size the sample
Estimate the number of responses you need using the sample size calculator, and plan for realistic response rates. A well-sized sample improves accuracy and allows you to draw conclusions with confidence.
4. Plan for precision
Define an acceptable range of error and verify it with the margin of error calculator. Setting these parameters early helps you balance reliability, cost, and speed.
5. Introduce your survey
Write a good introduction for your survey. Depending on your research, you might have to provide information about your academic institution or what you plan to do with the data.
6. Keep it short and logical
Respondents are more likely to complete shorter surveys. Limit the number of open-ended questions, which require more effort and time to answer. Use skip or branch logic and randomization to make the experience smooth and relevant.
7. Offer an incentive
If appropriate, you can encourage participation using survey incentives. Ensure the incentive matches the level of effort and population. For a general audience, discounts, points, or gift cards are among the most common survey incentives.
8. Collaborate and review
Before you launch, test your survey and gather feedback from teammates or other researchers. Use collaboration features to review bias, validate question flow, and confirm how you will analyze results, such as by using crosstabs or audience segments. Always preview the survey before sending to ensure a smooth experience for respondents.
Power your research with exploratory, descriptive, and causal surveys
Great decisions start with great data. Combine exploratory, descriptive, and causal surveys to move from open questions to measurable results and proven outcomes.
With SurveyMonkey, you can design smarter studies, reach verified respondents, and surface insights that drive confident action.
Get started free to launch your next survey in minutes. Or use SurveyMonkey Audience to reach the right people and collect results you can trust.
NPS, Net Promoter & Net Promoter Score are registered trademarks of Satmetrix Systems, Inc., Bain & Company and Fred Reichheld.
Discover more resources

Solutions for your role
SurveyMonkey can help you do your job better. Discover how to make a bigger impact with winning strategies, products, experiences, and more.

Product feedback surveys
Our product feedback surveys give you the insider knowledge you need to plan new products, grow your business and succeed in today's competitive marketplace. Here are a few ideas on how you can send product surveys, get feedback and develop successful marketing strategies. Get started now.

Why are surveys important in research?
Surveys are important in research because they offer a flexible and dependable method of gathering crucial data. Learn more today.

Survey methodology
How our survey scientists at SurveyMonkey conduct research, collect high-quality data, and uncover insights at an unmatched scale.