3 tips for writing agree/disagree scale questions
These tips for rating scale questions can help you optimize your surveys to improve data quality.

- An agree/disagree scale is a rating system where respondents express their level of agreement with a statement, typically ranging from "Strongly agree" to "Strongly disagree."
- It is important for measuring opinions, attitudes, or perceptions in a standardized way, allowing for easy comparison and analysis of responses.
- When writing agree/disagree survey questions, use a standard scale, map your answer options, and keep it simple.
Every day, we make decisions about things we agree, disagree, like, and dislike.
Typically, we think about it in binary terms: thumbs up or thumbs down, yay or nay. But if you’ve ever completed a survey, you’ve probably been asked to share your feedback using a 5-point Likert scale.
This type of agree/disagree scale gives you a broader spectrum of expression. This article explains the use of Likert scale questions and provides best practices and examples to help you craft a survey that provides reliable, quality data.
What is an agree/disagree scale?
The agree/disagree scale is a rating scale often used in surveys. This scale is named after its answer options.
Say you’ve been asked to provide feedback after interacting with a brand’s customer service team. The survey might ask you to convey how much you agree or disagree with a statement, such as “The agent resolved my concern today."
The agree/disagree scale, also known as a Likert scale, may offer options like “Strongly agree,” “Somewhat agree,” “Neither agree or disagree,” “Somewhat disagree,” or “Strongly disagree.”
Many researchers use a Likert survey because it is easy to use and adaptable. Still, it’s important to understand best practices to get the most reliable data.
3 tips for writing agree/disagree survey questions
Along with agreement, this scale can also gauge likelihood or importance (highly/not at all likely, very important/not at all important).
The agree/disagree survey question allows respondents to answer more precisely. Plus, it provides you with more nuanced survey responses to analyze.
When surveying people’s opinions, attitudes, or sentiments, take care crafting your questions. The following three strategies can help you to avoid bias and gather meaningful data.
1. Use a standard scale

When using the agree/disagree question type, people rate their agreement with statements on a scale (usually 1 to 5 or 1 to 7). Each option corresponds to a level of agreement (e.g., Strongly agree, Agree, Neutral, Disagree, Strongly disagree). This approach allows you to translate qualitative concepts like opinions or attitudes into quantitative data you can easily analyze.
To use a scale effectively, though, you must be consistent. Ensure you ask the same questions in the same format.
For example, if you were running a marketing survey asking a concertgoer about their experience, you might ask them to share feedback on the band on a scale from 1 to 5, with 5 being the highest. Then, in the next section, you might ask what they thought of the communication around the event. But you wouldn’t suddenly make 1 the highest and 5 the lowest.
By using a standard, fixed scale, you can more reliably compare data.
The standardization is part of what makes this type of scale simpler than the Thurstone scale. Using a Thurstone scale, you’d first generate statements representing various levels of satisfaction or dissatisfaction. Then, you’d assign the statements scores based on their favorability.
Returning to our marketing survey of concertgoers, you might have statements such as:
- "The artist’s performance exceeded my expectations."
(Experts might rate this as highly favorable, maybe a 10) - "I had to wait too long in line for refreshments."
(Experts might rate this as unfavorable, maybe a 1 or 2) - "The concert venue was difficult to find and poorly signposted."
(Experts might rate this as unfavorable, perhaps a 3 or 4)
Then, you’d have to calculate weighted scores based on the value associated with each statement. You can probably see why many people find a word scale like Likert simpler.
The Likert scale explained
Like the Likert scale, a word scale relies on descriptive word options to allow respondents to express their feelings rather than numbers, making it useful for gathering qualitative feedback. A word scale generally uses a spectrum of answer options ranging from extreme to extreme, sometimes including a moderate or neutral option.
Scales rating 1-5 are common, but 4- to 7-point scales are also popular. Nevertheless, depending on your topic or how granular you want to get with your data analysis, you can use a different number of answer options.
Is it better to use 5 or 7 points on the Likert scale?
Both Likert types are widely used and effective; your choice depends on your goal. Generally, a 7-point scale offers more detailed data with greater precision, while a 5-point scale is simpler and faster.
Likert scale examples
You can find rating scale examples in many different industries. This section offers 4-point, 5-point, and 7-point examples.
You might see a 4-point rating scale in a question from an ecommerce brand:
How satisfied or dissatisfied are you with the speed of product delivery?
- Very dissatisfied
- Dissatisfied
- Satisfied
- Very satisfied
Or a 5-point Likert scale in a survey from a tech company gauging consumer interest in their new app:
If this app were available for download today, how likely would you be to purchase it instead of competing products currently available from other companies?
- Not at all likely
- Extremely likely
- Very likely
- Somewhat likely
- Not so likely
In this employee engagement survey, the company used a 7-point scale:
How much do you agree or disagree that the company values its employee’s opinions?
- Strongly disagree
- Disagree
- Somewhat disagree
- Neither agree nor disagree
- Somewhat agree
- Agree
- Strongly agree
2. Map answer options to your question
The agree/disagree scale has many variations. You should map your question scale so respondents understand their options. Mapping also helps you represent all possible answers so respondents can find an option that fits their experience or opinion.
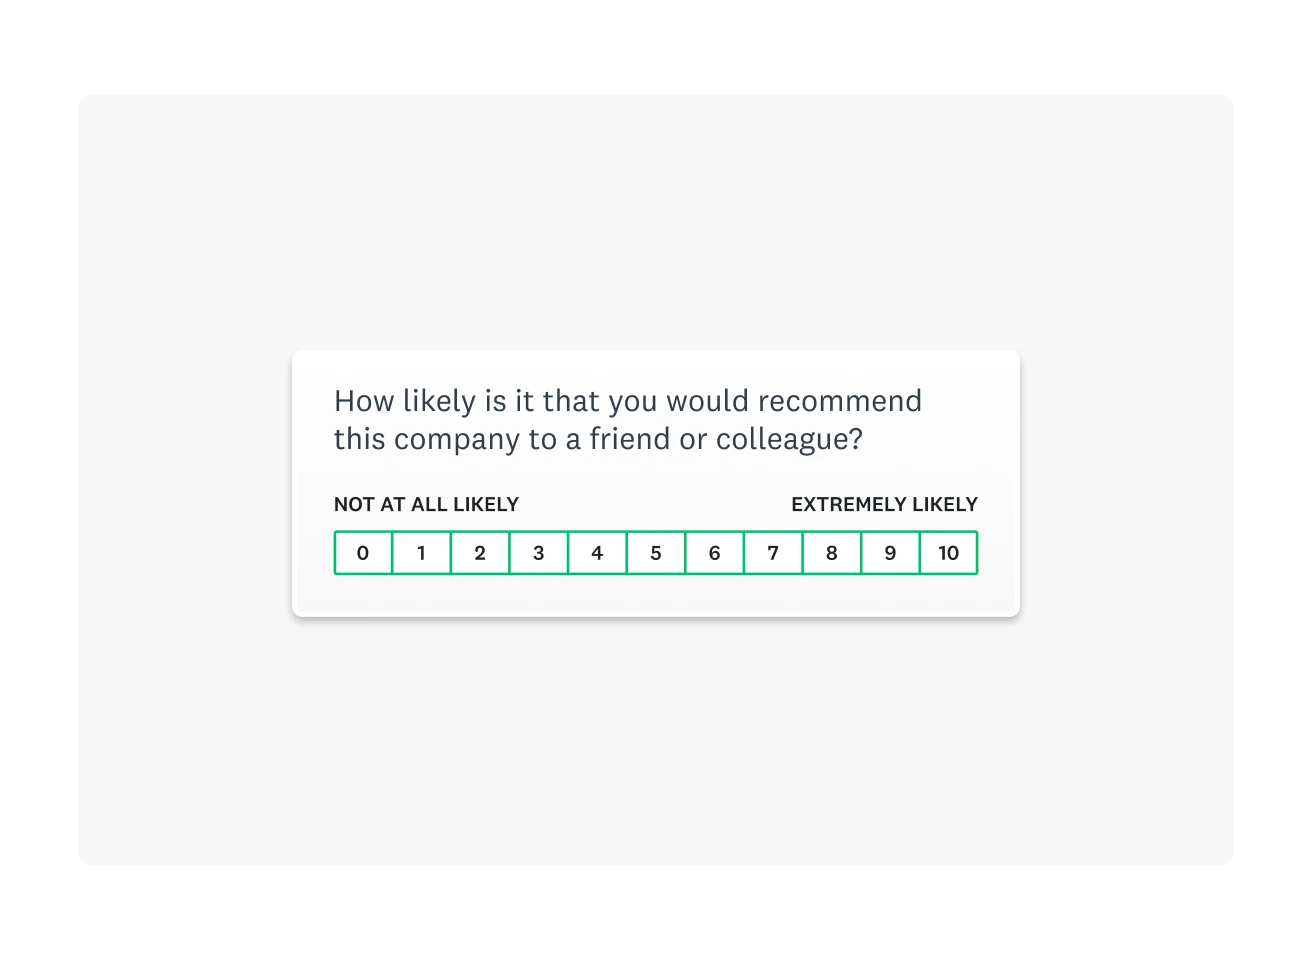
Our Market Research Survey Template is a 10-point example asking, “How likely would you recommend this product to a friend or colleague?” The response options are shown on a scale of 0 to 10, with “Not at all likely” anchoring one end and “Extremely likely” at the other.
For more granular survey research, we might ask, “How satisfied or dissatisfied were you with the new log-in screen?” This is called an item-specific question, meaning that response options are specific to the survey question. Research has found that, in general, the reliability and validity of item-specific scales are superior to those of agree/disagree scales.
3. Keep it simple and straightforward
Survey design is crucial to boosting survey completion rates. Keep your survey and questions clear and concise. Ensure your questions are easy to understand and you’re not asking too much of your respondents.
Also, before sending out your survey, review your questions to ensure they all address your survey goal. You want to ensure a strong focus, which helps you avoid overwhelming respondents.
Agree/disagree scale challenges
The seeming simplicity of the agree/disagree construct can lead to an acquiescence response bias. In general, people who answer surveys like to be seen as agreeable. So, when given the choice, they’ll say they agree — regardless of the actual content of the question.
Another concern is straight-lining. That’s when a respondent moves down a series of statements quickly, selecting the same answer choice for all. For example, in a Likert scale, a respondent might choose "Strongly agree" or "Neutral" for every item without considering the specific content of each question.
Agree/disagree rating scale examples
Ultimately, agree/disagree rating scales are useful in many areas. Take market research, for example. These questions can be helpful in psychographic surveys where marketers are trying to learn all about how customers behave and what motivates them.
A food and beverage company looking to understand its audience’s health consciousness before launching a new product line might ask, “To what extent do you agree with the following statement?"
I prioritize healthy eating when choosing new foods.
- Strongly agree
- Agree
- Neutral
- Disagree
- Strongly disagree
To gauge the consumers’ willingness to experiment with new foods, they might ask, "How much do you agree with the following statement?"
I enjoy trying new and unique food products when they become available.
- Strongly agree
- Agree
- Neutral
- Disagree
- Strongly disagree
Write reliable agree/disagree survey questions with SurveyMonkey
We hope you “strongly agree” that this article has helped you understand why researchers use this tool to get reliable insights and data. Likert scales go beyond a yes/no answer option to give you more insight into respondents’ opinions or attitudes.
To get the most out of your surveys, use expert-written survey templates and questions. When you use standard questions, you can benchmark your performance and compare it against others in your industry.
Discover more resources

Toolkits directory
Discover our toolkits, designed to help you leverage feedback in your role or industry.

You asked, we built it: Announcing our new multi-survey analysis feature
New multi-survey analysis from SurveyMonkey allows users to combine and analyze survey results into one single view.

Presidential debate 2024: How political debates impact public opinion
Reactions to the presidential debate were quick and decisive. New research on what people think and who will be the most influenced

What is a questionnaire? Definition, examples, and uses
Learn how to use questionnaires to collect data to be used in market research for your business. We share examples, templates, and use cases.