3 tips for writing agree/disagree scale questions
These tips for rating scale questions can help you optimize your surveys to improve data quality.

Sixty-two percent of workers say data improves decision-making, yet 64% admit to making poor decisions due to data issues. The disconnect isn’t about the value of data but its quality.
To make confident, informed business decisions, you need to go back to the source: your data collection methods. That starts with designing better surveys that align with your research objectives and deliver reliable, actionable insights.
Read our top tips for creating good surveys with agree or disagree questions.
What is an agree/disagree scale?
An agree/disagree scale is a rating scale often used in surveys to measure how much respondents agree or disagree with a statement.
The data collected from agree/disagree questions can be used to inform decision-making and improve customer or employee experiences.
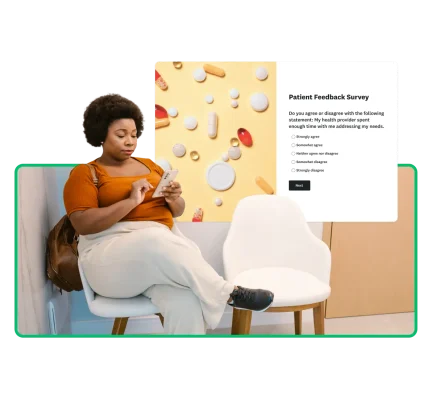
The agree/disagree scale is a Likert scale, and may offer options such as:
- Strongly agree
- Somewhat agree
- Neither agree nor disagree
- Somewhat disagree
- Strongly disagree
The agree/disagree is used frequently by researchers because of its ease of use and adaptability.
It’s important to note that all agree/disagree questions are Likert questions, but not all Likert scale questions are agree/disagree questions. Along with agreement, the agree/disagree scale can also gauge likelihood or importance (highly/not at all likely, very important/not at all important).
3 tips for writing agree/disagree survey questions
When surveying people’s opinions, attitudes, or sentiments, you should craft your questions carefully. Agree/disagree survey questions yield precise, nuanced responses for analysis. Here are several tips to help you avoid bias and gather meaningful data for your organization.
1. Use a standard scale

When using the agree/disagree question type, people rate their agreement with statements on a scale (usually 1 to 5 or 1 to 7). Each option corresponds to a level of agreement (e.g., Strongly agree, Agree, Neutral, Disagree, Strongly disagree).
This approach allows you to translate qualitative concepts like opinions or attitudes into quantitative data you can easily analyze. To use a scale effectively, though, you must be consistent by asking the same questions in the same format:
- Maintain consistent options (e.g., 5-point or 7-point scales) for similar questions to aid respondent rhythm and reduce errors.
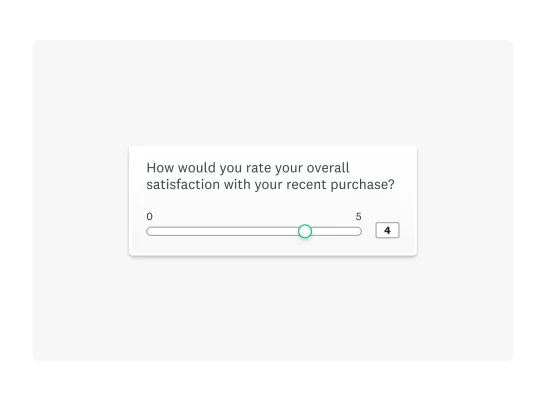
- Choose between bipolar scales (e.g., "strongly disagree" to "strongly agree") for opposing views, or unipolar scales (e.g., "not at all satisfied" to "extremely satisfied") for single attributes.
- Ensure consistent scale order (positive to negative or vice versa) throughout the survey to prevent confusion and bias.
By using a standard, fixed scale, you can more reliably compare data.
For example, if you were running a marketing survey asking a concertgoer about their experience, you might ask them to share feedback on the band on a scale from 1 to 5, with 5 being the highest.
Then, in the next section, ask what they thought of the event's communication. But you wouldn’t suddenly make 1 the highest and 5 the lowest. Inconsistent scales can lead to confusion among respondents and unusable data.
The Likert scale explained
All agree/disagree questions are Likert questions.
Like the Likert scale, a word scale relies on descriptive word options to allow respondents to express their feelings rather than numbers, making it useful for gathering qualitative feedback. A word scale generally uses a spectrum of answer options ranging from extreme to extreme, sometimes including a moderate or neutral option.
Scales rating 1-5 are common, but 4- to 7-point scales are also popular. Nevertheless, depending on your topic or how granular you want to get with your data analysis, you can use a different number of answer options.
Neutral options in odd-numbered agree/disagree scales can increase data accuracy by allowing ambivalence. But it may lead to "satisficing," where respondents overuse the neutral option, obscuring true preferences.
Forced-choice scales eliminate neutrality, providing clear, actionable data, especially for strong opinions. However, this can frustrate neutral respondents, leading to inaccurate data or abandonment.
Four-point, 5-point, and 7-point Likert scales are widely used and effective. The best approach depends on research goals, topic, and audience.
Likert scale examples
You can find rating scale examples in many different industries. This section offers 4-point, 5-point, and 7-point examples.
You might see a 4-point rating scale in a question from an ecommerce brand:
The product meets my expectations.
- Strongly agree
- Agree
- Disagree
- Strongly disagree
You might see a 5-point Likert scale in a survey from a tech company gauging customer effort:
The product is easy to use.
- Strongly agree
- Agree
- Neutral
- Disagree
- Strongly disagree
In this employee engagement survey, the company used a 7-point scale:
How much do you agree or disagree that the company values its employees’ opinions?
- Strongly disagree
- Disagree
- Somewhat disagree
- Neither agree nor disagree
- Somewhat agree
- Agree
- Strongly agree
2. Map answer options to your question

The agree/disagree scale has many variations. You should map your question scale so respondents understand their options. Mapping also helps you represent all possible answers so respondents can find an option that fits their experience or opinion.
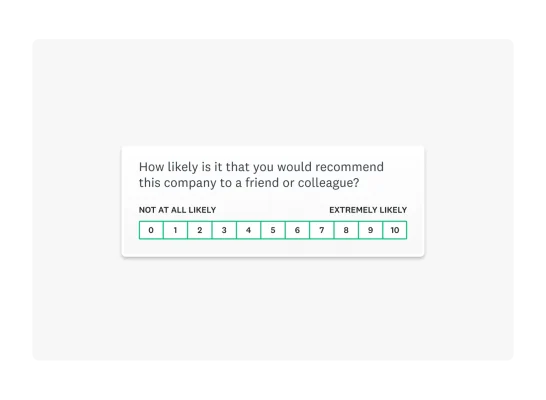
Our Market Research Survey Template is a 10-point example asking, “How likely would you recommend this product to a friend or colleague?” The response options are shown on a scale of 0 to 10, with “Not at all likely” anchoring one end and “Extremely likely” at the other.
For more granular survey research, we might ask, “How satisfied or dissatisfied were you with the new log-in screen?” This is called an item-specific question, meaning that response options are specific to the survey question. Research has found that, in general, the reliability and validity of item-specific scales are superior to those of agree/disagree scales.
3. Keep it simple and straightforward
Survey design is crucial to boosting survey completion rates. Keep your survey and questions clear and concise. Ensure your questions are easy to understand and you’re not asking too much of your respondents.
Also, before sending your survey, review your questions to ensure they all address your survey goal. You want to ensure a strong focus to help you avoid overwhelming respondents.
Agree/disagree rating scale examples
Ultimately, agree/disagree rating scales are useful in many areas. Take market research, for example. These questions can be helpful in psychographic surveys that aim to understand how customers behave and what motivates them.
Example 1
A food and beverage company looking to understand its audience’s health consciousness before launching a new product line might ask, “To what extent do you agree with the following statement?"
I prioritize healthy eating when choosing new foods.
- Strongly agree
- Agree
- Neutral
- Disagree
- Strongly disagree
To gauge the consumers’ willingness to experiment with new foods, they might ask, "How much do you agree with the following statement?"
I enjoy trying new and unique food products when they become available.
- Strongly agree
- Agree
- Neutral
- Disagree
- Strongly disagree
Example 2
An HR team looking to measure employee satisfaction might ask, “How much do you agree with the following statement?"
I feel supported by my direct manager.
- Strongly agree
- Agree
- Neutral
- Disagree
- Strongly disagree
To gauge if the company is providing adequate training, they may also ask, “To what extent do you agree with the following statement?"
I am given ample opportunities to upskill at work.
- Strongly agree
- Agree
- Neutral
- Disagree
- Strongly disagree
Example 3
A marketing team seeking to understand how their product fits in the market might ask, “To what extent do you agree with the following statement?"
[Product X] is priced fairly for the value it provides.
- Strongly agree
- Agree
- Neutral
- Disagree
- Strongly disagree
To gauge consumers’ satisfaction with the product’s features, the marketing team may also ask, “How much do you agree with the following statement?"
[Product X] has all the features I want.
- Strongly agree
- Agree
- Neutral
- Disagree
- Strongly disagree
How to write effective agree/disagree questions
Creating effective agree/disagree questions for a survey involves several key steps to ensure clarity, reduce bias, and collect meaningful data. Here's a breakdown of the process:
1. Start with clear objectives
Before you write a single question, determine what you want to learn. Ask yourself:
- What specific construct, belief, or attitude are you trying to measure?
- How will you use and present the information you collect?
- What actions will you take based on the results?
Having a clear purpose will help you focus on questions that are directly relevant and actionable.
2. Write the question or statement
Agree/disagree questions often use a declarative statement followed by a rating scale. Here are the best practices for crafting the statement itself:
- Be specific and concrete: Avoid broad or abstract ideas. Instead of asking "I am confident in my ability to communicate effectively," a better question would be "I am confident in my ability to present my research findings at a conference."
- Ask one thing at a time: Don't "double-barrel" your questions. Look for conjunctions like "and" or "or." For example, instead of "The new policy has reduced crime and violence on campus," split it into two separate questions: one for crime and one for violence.
- Use clear, simple language: Avoid jargon, abbreviations, or complex wording that your audience might not understand. Phrase your questions at a 9th to 11th-grade reading level.
- Avoid double negatives: A statement like "I don't disagree with the new policy" is confusing. Rephrase it positively as "I agree with the new policy."
- Avoid leading or biased wording: Keep statements neutral to reduce response bias. For example, instead of “This product dramatically improved my daily routine”, try “This product improved my daily routine.”
3. Design the response scale
The response options are just as important as the question.
- Choose the number of options: A 5- or 7-point scale is most common as it provides a good balance between data detail and respondent ease. Fewer options can oversimplify responses, while too many can lead to confusion and fatigue.
- Decide on a neutral option: An odd-numbered scale includes a neutral midpoint, which allows for genuine ambivalence. An even-numbered scale forces a choice, which can be useful when you want to eliminate the middle ground but may also frustrate respondents who are genuinely neutral.
- Label the scale clearly: Use descriptive words instead of numbers to avoid confusion. The labels should be equally spaced, and the number of positive and negative options should be balanced.
- Maintain consistency: Use the same scale format, number of options, and order for all similar questions throughout the survey. This helps respondents develop a rhythm and reduces cognitive load.
- Test before launching: Send your survey to a small group before launching it to your sample so you can tweak any issues that arise from the test group.
4. Pilot test your questions
Before launching your survey, test it with a small group of people from your target audience. This is crucial for identifying any misleading, confusing, or ambiguous questions. Use their feedback to refine your wording and ensure your questions are clear and effective.
Advantages of agree/disagree questions
There are many benefits of using agree/disagree questions in your survey, including:
- Quick to answer: Since most people are familiar with this survey question format, it's easy and fast to respond. This promotes higher completion rates.
- Measure attitudes and opinions: Agree/disagree questions are effective for gauging sentiment, attitudes, and levels of agreement. They are especially effective for customer satisfaction, employee engagement, and consumer research.
- Simple to quantify: By using a Likert scale, you can turn responses into quantifiable data points.
- Easy to benchmark: When you use standard questions, you can benchmark your performance and compare it against others in your industry.
Disadvantages of agree/disagree questions
While agree/disagree questions are great in most cases, there are a few disadvantages you should also consider.
- Acquiescence bias: In general, people who answer surveys like to be seen as agreeable. So, when given the choice, they may say they agree—regardless of the actual content of the question.
- Risk of straight-lining: Straight-lining occurs when a respondent moves down a series of statements quickly, selecting the same answer choice for all. This practice can skew your survey results.
- Limited nuance: Complex opinions can be difficult to capture with a simple agree/disagree framework.
Write reliable agree/disagree survey questions with SurveyMonkey
Agree/disagree survey questions provide researchers with rich insights to inform data-backed decisions. Using a standard scale, such as the Likert scale, ensures you obtain reliable and usable data. Mapping your answer options helps survey respondents understand how to answer accurately. Lastly, keeping your survey questions straightforward supports accurate data.
To get the most out of your surveys, use expert-certified survey templates and questions from SurveyMonkey. Get started today by signing up for a free account.
Discover more resources

Solutions for your role
SurveyMonkey can help you do your job better. Discover how to make a bigger impact with winning strategies, products, experiences, and more.

Travel survey questions: 40+ examples to improve guest and traveler feedback
Use these 40+ travel survey questions and templates to collect feedback, boost guest satisfaction, and improve every traveller’s experience.

When you need to ask follow-up questions
Follow-up questions are a great tool to gather more insightful, specific data from surveys. Here's how and when you need to ask follow up questions.

The pros and cons of survey prizes
Explore the pros and cons of offering survey prizes, assess whether you need them, and learn best practices for using survey incentives effectively.