Should pets be allowed in the bed? Are women really more likely than men to like cats? How many people would choose a pet lion over an eagle?
April 11th is National Pet Day, and we took the opportunity to use SurveyMonkey Audience to get a sneak peak into 667 people’s personal relationships with their pets, their house rules, and their #petgoals.
How many people have pets?
There may be few things that today’s Americans share in common as much their ownership and love of their pets—96% of people have had an animal of some sort at some point in their life.
Cats (67%), dogs (87%), and fish (60%) were the most common pets, but birds (29%), hamsters (28%), and rabbits (26%) were also very popular. Scaly friends like lizards (13%) and snakes (11%) were rarer, but still very well represented.

In addition to these mainstream pets, our respondents shared some of the more unusual critters that they’ve welcomed into their family. These included:
- Goats
- Turtles
- Horses
- Hermit crabs
- Tarantulas
- Prairie dogs
- Ducks
- Hedgehogs
- Ferrets
- Salamanders
- Snails
What are the most common rules for pets?
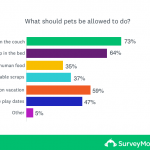
Hell hath no fury like a dog that hasn’t been house-trained. But the rules for pets (primarily dogs and cats) change from household to household. Some dogs might be allowed on the couch while others are. Some cats be able to snag tables craps at dinner time, while others are strictly limited to kitty chow. We wanted to know which rules people were the most flexible about and where they were willing to bend the rules.

As it turns out, most people don’t care too much about where their pets hang out—73% think it’s fine to have pets up on the couch and 64% are cool with animals on the bed. Food habits, though, is where pet parents get stricter. Fewer than 37% would give their pets human food or table scraps.
Many people wish that their employers would be a little more relaxed about pets, too. 52% think pets should be able to come into work (barring allergies or behavior problems). This is an especially popular opinion among millennials: 65% would like to be able to bring Fido to the office.
Related: A study on what bothers us the most
How do people identify with their pets?
We also asked a few questions about how people define themselves relative to pets, starting with the age old question: cat person or dog person? We also offered a third option (both!) for those who can’t bring themselves to choose.
When we asked this question at SurveyMonkey recently, we found ourselves to be a solidly dog-leaning office, but with a big heart for both.
It turns out, we’re not alone: Only 15% of our respondents chose cats, while a 60% majority consider themselves dog people. A warm-hearted 26% liked both equally.
Women were no more likely than men to lean cat-ward. 19% of men and 20% of women put felines first.
We also had a little fun with the survey. If each of our respondents was a billionaire, and guaranteed to have personal safety and humane treatment of their pet, what would the dream pet be? We included options like lions, giraffes, owls, sharks, and bears. Most people went with “horse”, but our youngest respondents (under 21) thought a lion might be more fun.
There were also some amazing (and rare) write-ins, including:
- Pangolin
- Monkey (We’re a big fan of this one.)
- Panda
- Sloth
- Pika
How do pets make their people feel?
Studies have shown that pet ownership is connected to better mental health and even longer life. That probably wouldn’t be surprising news for our respondents, whose pets made them feel “happy,” “loved,” and “calm.”
Asked to describe their pets in three words, here were the terms that came up the most:

Happy National Pets Day, from us to you and all your scaly, feathered, furred, slimy, and fuzzy family members!
Want to ask your own q's?
SurveyMonkey Audience lets you survey the precise demographics that you're curious about.


