The special election for U.S. Senate in Alabama helped demonstrate how minor variation in polling methods can make a big difference in which candidate appears to be ahead or behind. That spread, combined with what we now know about the election outcome, provides some early lessons in how to interpret public polling, especially over the next year.
SurveyMonkey conducted polling in Alabama, Virginia and New Jersey this year, largely as a research and development project, aimed at refining our election polling methods for 2018 and beyond (some results we published, such as this analysis on Virginia, but much we did not).
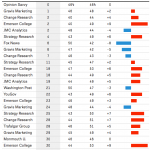
A few days before the Alabama election, we took the unusual step of publishing eight very different estimates of likely voter preferences in that contest, all based on the same survey data. An update published on election eve showed similar results, varying between an 11-point lead for Democrat Doug Jones and an 8-point lead for Republican Roy Moore. Our aim was to demonstrate the difficulty pollsters faced in making a precise prediction of the outcome, given the relatively close contest combined with unusual variability due to relatively modest differences in likely voter models. The spread was similar to the results from public polls released by other organizations, which ranged between a 10-point lead for Moore to a 9-point lead for Jones, according to a FiveThirtyEight compilation.
While the data collection for our experimental 2017 surveys is mostly complete, our assessment and analysis is just getting started. Here, however, are four lessons we can share now.
Lesson 1: Intent to vote foreshadowed turnout
First, our polling in all three states provided advance warning that voter turnout would benefit the Democrats more than usual. Democrats in these states were significantly more likely than Republicans to report being “absolutely certain” to vote or having already voted. The gap was four percentage points in New Jersey (75 vs. 71 percent), six points in Virginia (82 vs. 76 percent) and 14 points in Alabama (83 vs. 69 percent).
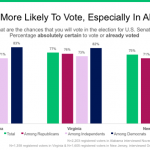
This pattern is unusual, since Republican voters are more likely to be older and white, subgroups that typically turn out a higher levels and report greater intent to vote. Not so in 2017.
This atypical pattern from our pre-election surveys matches the higher turnout observed in Democratic localities in Alabama, Virginia and New Jersey. Similarly, in special elections for the U.S. House held elsewhere in 2017, vote totals imply heavier voter turnout among Democratic voters.
The results from Alabama are worthy of special caution. The nature of the contest – a special election held in mid-December, with no comparable previous vote history to guide judgments about voter turnout – created obvious challenges for pollsters and influenced our decision to release results for multiple scenarios.
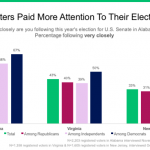
The high-profile allegations of sexual misconduct made against Republican nominee Moore may have had even greater consequence, however, as they helped create unusually high voter engagement. In the final week of each respective election, far more voters in Alabama said they were following the election very closely (60 percent), than voters in Virginia (43 percent) or New Jersey (33 percent).
Lesson 2: Calibrating ‘likely voter’ composition remains a challenge
Our surveys, like those from many other organizations, had evidence that Democrats would likely benefit from more favorable voter turnout in 2017. The harder part this year – and the challenge that remains for pollsters in 2018 and beyond – is determining how to use those results to project a likely electorate.
As explained in more length in our final pre-election analysis in Alabama, our released models fell into two categories: Two were based on past turnout as reported by our respondents (the two columns on the far right in the table below). Two others did not. We combined these findings with a separate assessment, of the demographic composition of past Alabama elections based on U.S. Census survey data. Given that the models based on past turnout were yielding demographic compositions that were more white and male than recent past elections, we voiced skepticism, “about the models that incorporate self-reported past turnout.”
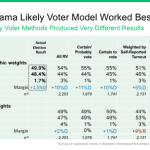
The narrow Jones victory, combined with evidence from vote returns and exit polls of a heavier than usual turnout among African Americans, implies that the most accurate likely voter models for Alabama were those based on self-reported intent to vote combined with a weighting scheme for all registered voters that took 2016 vote preference into account (more about the latter adjustment below).
Results were broadly similar in the two other states, in that self-reported likely voters generally produced a more accurate result than models based on self-reported past turnout. However, no one approach proved best in all three states. In New Jersey, the most accurate model narrowed to voters who were “absolutely certain” to vote or had already voted. In Virginia, that narrower model would have overstated Democrat Northam’s margin, while a model that also included those who would “probably” vote came within a single point of the actual outcome.
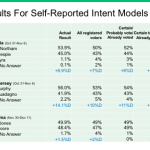
Given the variation, and the ongoing debate among pollsters on the challenge of modeling likely voters, we have not yet settled on any single approach going forward. While we hope to use the 2017 findings to further refine our methods on this score going forward, it remains a hard problem.
Lesson 3: Publishing multiple estimates is a good thing
While we will not likely publish upwards of 8 results again, we do see value in publishing multiple likely voter estimates for future elections.
Most pollsters examine multiple models internally, and we have been working to make SurveyMonkey’s election tracking serve as a platform that our media partners and customers can use (with our guidance) to come to their own conclusions about what models to apply.
Also, the political polling industry has been working to devise better methods to convey uncertainty. In Alabama, our release of multiple estimates, as well as the similar effort by the Monmouth University poll, helped communicate the uncertainty inherent about the outcome, which we see as a positive result.
Ideally, future releases of multiple vote results will come with guidance on which particular estimate appears best, along with a sense of the range of results that slightly varying ‘likely voter’ mechanics can produce. The combination could be a meaningful supplement to the traditional way of thinking about the “margin of error.”
Lesson 4: Weighting by 2016 vote boosted accuracy in Alabama
Finally, our estimates in Alabama were more accurate when we weighted the initial registered voter sample so that self-reported 2016 presidential vote choice, among all who said they voted in 2016, matched actual results.
That was not the case this year for our survey in Virginia, and while the 2016 result was slightly off in New Jersey, it erred in the opposite direction, overstating Trump’s margin.

Once we weighted our data in those states demographically, self-reported 2016 vote was a reasonably close match to actual results in both states. Although some pollsters have made a convincing case for taking past, self-reported vote choice into account, it is not an approach SurveyMonkey has used previously, so we were cautious about doing so in Alabama.
Nonetheless, had we not weighted by past vote in Alabama, our estimates would have either vastly understated the apparent composition of women and African Americans among those who voted or vastly overstated Doug Jones’ victory margin. At the very least, our Alabama experience convinces us that weighting on past vote needs to be a part of our available “tool kit” moving forward.
Some of these lessons may be specific to the the individual state or race or the unique nature of SurveyMonkey’s platform. Nevertheless, three states with diverse politics -- red, blue and purple in the 2016 presidential election -- all yielded similar patterns by party in self-reported intent to vote that foreshadowed actual turnout. That finding alone provides an important lesson for 2018.


