How do people prefer to communicate? The answer depends on what they’re trying to achieve.
People’s communication preferences aren’t always intuitive. Video is one of the most popular (and trustworthy) ways to consume content, but that doesn’t necessarily mean the future is video: 41% of people use video calling less than they did last year and only 13% use it more. And in spite of common claims that “email is dead,” more people are using email than ever before.
To learn about these idiosyncrasies and understand how people prefer to communicate we partnered with Drift to survey a panel of over 1,000 U.S. consumers on SurveyMonkey Audience—for the second year in a row. Check out Drift’s full report here.
What we learned: people are wary of next generation communication right now, but when it comes to interacting with companies and organizations, their preferences suggest for efficiency outweighs their hesitancy.
What people care about when talking to brands: speed, convenience, and solving problems
What gets under people’s skin? The frustrations that come up the most frequently are telling when it comes to finding the channels that will be the most successful.
Among the most common complaints were inability to find answers or business details, while companies being “impersonal” or inactive on social media were lesser concerns. It’s possible that organizations are simply already doing those things really well, but it’s also possible that people care less about the “social” parts of interacting with a brand and more about reaching solutions quickly–even if it means searching for answers themselves.
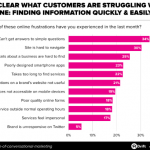
Responsiveness (50%) and helpfulness (41%) are also the things that are most important to consumers trying to interact with a chatbot. Only 38% listed “would rather talk to a human” as their number one concern.
If people care so much about getting quick, effective answers, you might think that automated chatbots would be a top pick. You’d be wrong.
Want to get your own industry insights?
Reach targeted survey respondents with SurveyMonkey Audience
How people communicate right now and where chatbots fit in
Email, smartphone apps (including messaging apps), and telephone are still the dominant ways that people communicate, and are only growing. Interestingly, though, online live chat is and chatbots are both becoming more common, with online live chat even surpassing social media.
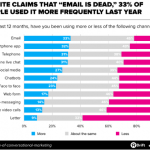
The high number of reports of online chat raises a question: do people know when they’re interacting with a real person vs. a bot? Only 13% of the respondents in our study reported using a chatbot last year, but a recent study shows that 58% of B2B and 42% of B2C companies use chatbots on their websites—meaning they’re much more common than consumers might expect.
Nevertheless, trust for chatbots is low, not because bots aren’t friendly enough but because people don’t trust bots to truly help them solve their problems.
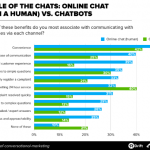
People expect both human chat and chatbots to be convenient and readily accessible, but there are huge differences when it comes to ease of communication (40% for humans vs. 25% for bots) and good customer experience (39% vs. 16%).
Different people—different preferences
But not everyone shares the same preferences. Maybe unsurprisingly, younger people are more likely to increase their of use online chat and chatbots than older people.
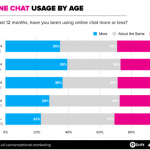
People also might have different preferences depending on the type of interaction (asking a question about a product or service, looking to make a change, etc.) At the end of the day, communication comes down to listening to customer preferences.
Apply communications research takeaways to your survey
As a form of communication themselves, surveys deserve the same level of scrutiny as chatbots or email.
If speed and convenience are such a priority for consumers in general, you can bet that your survey respondents will likely share those preferences. There are a few ways that you can keep your surveys as frictionless as possible.
- Keep it quick. Obviously your needs change depending on your use case, but in general its best to keep your surveys to 10-15 questions or fewer, and aim for question types that require less work from the respondent (e.g. multiple choice instead of open-ended questions.) SurveyMonkey Genius can help you estimate how long your survey will take to complete.
- Time it well. Our research shows that the most popular times to answer surveys are weekdays between 7a.m. and 10a.m. and 2p.m. and 5p.m. Weekends and evenings are, unsurprisingly, not popular times for survey-taking. If you want to make your survey more convenient (and boost response rates), aim to send it just before one of those windows.
- Streamline channels. Embedding the first question of your survey into an email increases the completion rate by 22%. Why? Because it’s easier and more convenient to interact with something that’s right in front of you.
Just like the consumers in our research who got frustrated by unintuitive websites, survey respondents like to keep things straightforward. Embedding survey questions into emails, or adding a QR code to product packaging or presentations are good ways to ease the experience. - Respond quickly. If your survey is likely to set an expectation (e.g. asking event attendees whether they’re interested in information about future events or customers if they’re happy with a new feature), make sure that you’re ready to react to that feedback in a timely manner. The data shows that unresponsiveness is a major frustration. If attendees request more information but don’t get it, or flag an issue with their product experience that you never address, you risk alienating them.
It’s clear what today’s consumers want: quick, straightforward interactions that give them the answers they need and make them feel heard. Whether they’re using chatbots, email, or surveys, brands need to be ready to deliver that experience.
Learn how to do your own market research
Our ultimate guide has best practices from our experts

