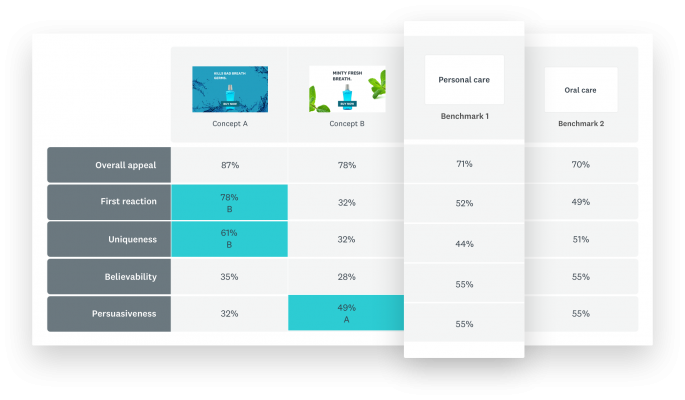
Benchmarks are a really useful way to put your concept testing research results in perspective. Let’s say your survey results indicated that 67 percent of your target audience said they would be very likely to make a purchase once your new product is available. Sounds amazing, right?
But, we all know that people don’t always behave the way they say they will. So how good is 67 percent—and does it indicate that your product will do better than similar products that are already in the market?
To answer these questions, researchers use benchmarks. Benchmarks tell you how well an average concept performs in a certain industry, and gives you a way to effectively compare your own concept against this industry standard.

However, a benchmark is only as good as the data behind it. If you can’t trust the benchmark data, then no matter how amazing the idea of having a benchmark sounds, you’ll probably just ignore it.
In this article, we’ll dive into the quality of the SurveyMonkey concept testing benchmark database that you can access via our 7 new expert solutions, and why you can trust these benchmarks to make better decisions.
Why all benchmarks are not created equal
One of the first questions you should ask about benchmark data is, how recently it was collected? In most cases you need data that was collected within the last 6 to 12 months.
Why? Because market preferences change constantly. A couple of years ago, alternative meats were merely a thing, but now they can be found everywhere—in fine restaurants, fast food joints, and grocery stores for home use.
Suppose you plan to launch a new alternative meat product, and the benchmark data on market preferences indicates that there is a lot of demand, but few suppliers. Great. But, what if that data is 2 years old? And in that two years, your novel idea has gone mainstream? You might mistakenly conclude that your alternative meat idea is much more unique and differentiated than the benchmark states, and that it’s going to conquer the world. And, you would enter the market with a completely different view of the competitive landscape.
To make sure that you have the latest data to compare against, we make sure that all of our benchmarks are freshly generated.
Benchmarks that are relevant and tailored for your industry
We recognize that the power of benchmarks is relevance, and that most industries have their own unique attributes. That’s why we’ve designed our benchmark data to be industry-specific, to better address the challenges that marketers and insights professionals face.
Depending on what type of concept you are testing (ad, logo, name, product idea, etc.), we have up to 45 unique industries for you to select from. Using the broad “Drinks” industry as an example, you can either choose to purchase benchmarks for the entire Drinks industry, or for any of the four sub-industries (spirits, wine, non-alcoholic drinks and breweries).
For each industry, we generate benchmarks from at least 10 concepts (i.e., the sample size = 10). To determine which concepts are included, we select companies based on revenue and sales. For example, to establish logo testing benchmarks for the “Skin Care” industry, we compiled the performance data from companies based on high revenue and best sellers.
How we generate our benchmark data
We used at least 2,000 survey responses per industry, and to ensure comparability, our benchmarks are also survey-based (see our sample survey here). We showed each respondent one-by-one a random set of 3 out of 10 concepts from the same industry, and then followed up with attribute questions. We matched the wording and answer options of the attribute questions exactly with those in the SurveyMonkey expert solutions for concept and creative testing, so you know you’re comparing apples-to-apples.
After collecting at least 200 responses per concept, we first calculated the attribute score for each concept separately (e.g. 70 percent of respondents think logo A is unique) and then aggregated it to the industry level (e.g. for an average logo in the industry, 65 percent of respondents think it’s unique).
As you can probably imagine, hundreds of thousands of survey respondents need to be collected to create a comprehensive database that covers many industries. And, SurveyMonkey is in a unique position to solve that challenge.
Every day, over 2 million people answer surveys created using SurveyMonkey. When they come to the end of their survey, we show them a “thank you” page in which we ask a random subset of people to participate in our benchmark surveys and give their opinions on a few concepts. This process not only gives us quick access to a large account of respondents, but it also gives us access to respondents who are diverse and representative of the market.
They’re not just customers, employees, market researchers, or event attendees; people across the world use SurveyMonkey to answer surveys on anything you can imagine. We use the same data for our SurveyMonkey Contribute panel as we do for our benchmarks, so you can be sure that our benchmarking reveals actual differences in respondent preferences, not discrepancies between the data. Click here to see more details about our sample source.
Learn more about using Benchmarks in SurveyMonkey expert solutions.


