We value your privacy

We and our third party partners may use cookies and similar technologies on this site to analyze usage, optimize our services, personalize content, tailor and measure ads and keep this site secure. Privacy Notice Cookies Notice
en
Contact SalesLog in
Contact SalesLog in

Get insights to inspire better decisions, create experiences people love, and drive business growth

Axios

Axios|SurveyMonkey Poll: 2021 year-end results

Axios|SurveyMonkey Poll: 2021 year-end results

Key findings:

  • More than half of U.S. adults say they’re fearful for what the year 2022 holds in store for both the U.S. (51%) and the world (54%).
  • In addition to the grim outlook for the U.S. and the world, adults have less hope for themselves. 30% say they’re more fearful about what 2022 holds in store for themselves.
  • Covid fatigue: 35% said they’d like to hear less about COVID-19 in 2022.
  • Amid current concerns of inflation and economic woes, 50% expect 2022 to be a bad year for the U.S. economy.
  • Politics remains top of mind for many: 17% cite ‘democracy’ as the most important issue—second to “jobs and the economy” at 31%.

2021 vies for the lead as ‘worst year’

About half (51%) of adults in the U.S. say they’re fearful for what the year 2022 holds in store for the country, and slightly more (54%) are fearful for what 2022 holds in store for the world, according to a new Axios|SurveyMonkey poll. The percentage who say they are fearful about what’s in store for the world exceeds last year’s 36% as well as the pre-pandemic results from 2018 (48%) and 2017 (52%). 
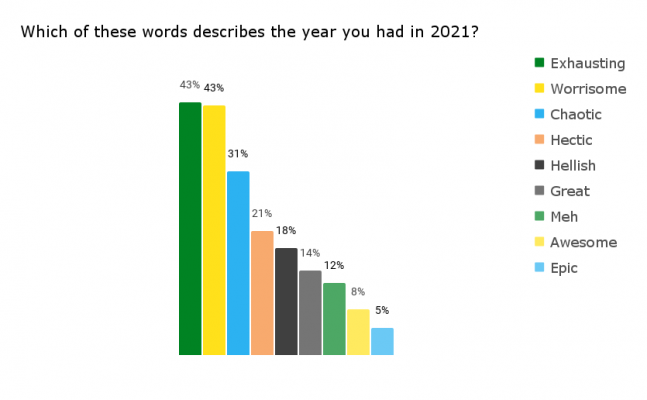
Which-of-these-words-describes-the-year-you-had-in-2021

Think 2020 was bad? This year vies to compete as most described their year to be “exhausting” (43%) and “worrisome” (43%), on par with 2020 levels (45% and 46%, respectively), but up substantially from 2018 (30% and 28%, respectively).  

Lack of hope reaches an all-time high 

In addition to the grim outlook for the U.S. and the world, adults have less hope for themselves. Three in 10 (30%) say they’re more fearful about what 2022 holds in store for themselves, reaching an all-time high compared to those who said the same in 2020 (25%), 2018 (22%), and 2017 (28%).  

Older adults are most likely to have concerns about the upcoming year compared to younger generations. One in 4 (40%) of those in the Silent Generation and 36% of Boomers are fearful for what lies ahead in 2022 compared to only 16% of Gen Z.

Covid fatigue sets in 

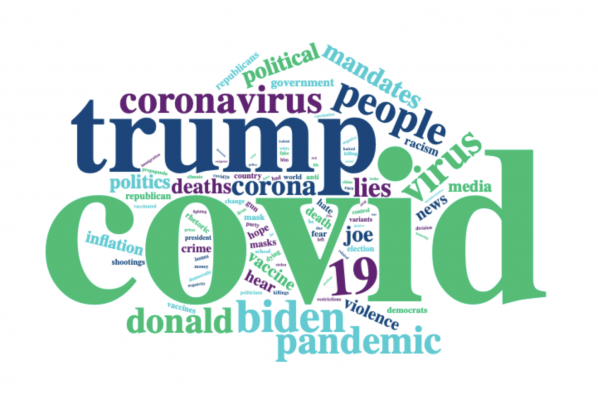
Almost two years into the pandemic, most adults say they’re feeling tired, and not necessarily due to symptoms of COVID-19. When asked about one thing they’d like to hear less of in the next year, about 3 in 10 (35%) said COVID-19. 
wordcloud-hopetohearlessof-overall

Their pandemic fatigue may be, in part, led by the hope for it to improve in the next year. Around 6 in 10 (61%) say they’re hopeful about what 2022 holds in store for the pandemic. However, hope has waned compared to this time last year; more than 7 in 10 (76%) felt 2021 would bring relief to the pandemic.

Economic concerns carry over to 2022

Amid current concerns of inflation and supply chain woes, half (50%) of adults feel 2022 will be a bad year for the U.S. economy with almost 2 in 10 (17%) predicting it will be a “very bad year” for the economy. Despite Gen-Z’s usual optimism, this remains true across the majority of generations, yet white adults are among the most likely to have a negative outlook for the economy in the coming year (56%). In comparison, only 28% of Blacks, 44% of Hispanics, and 41% of Asians feel the same. 

Politics remains top of mind for many: 17% cite ‘democracy’ as the most important issue—second to “jobs and the economy” at 31%. The issue of 'democracy' is particularly popular among those with a postgraduate degree (31%) and Democrats and Democratic leaners (24%). On the contrary, only 9% of those with a high school degree or less, 15% of Republicans and 7% of independents view the issue with the same level of importance. 

Read more about our polling methodology here
Click through all the results in the interactive toplines below:

Survey dates: 

Sample size: 2,602

  • Which one of the following issues matters MOST to you right now?

    Gender
    AnswerTotalMaleFemale
    Unweighted N2,6021,3551,247
    Jobs and the economy
    31%
    33%
    28%
    Democracy
    17%
    19%
    14%
    Health care
    16%
    13%
    19%
    Education
    8%
    8%
    9%
    The environment
    8%
    7%
    10%
    Immigration
    7%
    8%
    5%
    Terrorism
    2%
    1%
    2%
    Foreign policy
    2%
    2%
    1%
    Other (please specify)
    8%
    9%
    7%
    No answer
    2%
    1%
    2%
    Question wording: Which one of the following issues matters MOST to you right now?
    Survey dates: 
  • It’s almost the end of the year. What word or words would you use to describe the year you had in 2021? (Select all that apply.)

    Gender
    AnswerTotalMaleFemale
    Unweighted N2,6021,3551,247
    Exhausting
    43%
    38%
    48%
    Worrisome
    43%
    40%
    45%
    Chaotic
    31%
    29%
    33%
    Hectic
    21%
    19%
    23%
    Hellish
    18%
    16%
    21%
    Great
    14%
    14%
    15%
    Meh
    12%
    13%
    11%
    Awesome
    8%
    7%
    9%
    Epic
    5%
    5%
    5%
    No answer
    2%
    1%
    2%
    Question wording: It’s almost the end of the year. What word or words would you use to describe the year you had in 2021? (Select all that apply.)
    Survey dates: 
  • How about for the country as a whole, which of these words describes 2021 for the United States? (Select all that apply.)

    Gender
    AnswerTotalMaleFemale
    Unweighted N2,6021,3551,247
    Worrisome
    55%
    53%
    57%
    Chaotic
    45%
    45%
    45%
    Exhausting
    32%
    29%
    35%
    Hellish
    27%
    25%
    29%
    Hectic
    22%
    19%
    25%
    Meh
    8%
    8%
    9%
    Great
    6%
    7%
    6%
    Awesome
    4%
    4%
    4%
    Epic
    4%
    4%
    4%
    No answer
    2%
    1%
    2%
    Question wording: How about for the country as a whole, which of these words describes 2021 for the United States? (Select all that apply.)
    Survey dates: 
  • Looking ahead to next year, are you more hopeful, or more fearful, about what the year 2022 holds in store for you personally?

    Gender
    AnswerTotalMaleFemale
    Unweighted N2,6021,3551,247
    More hopeful
    68%
    66%
    70%
    More fearful
    30%
    33%
    28%
    No answer
    2%
    1%
    2%
    Question wording: Looking ahead to next year, are you more hopeful, or more fearful, about what the year 2022 holds in store for you personally?
    Survey dates: 
  • Looking ahead to next year, are you more hopeful, or more fearful, about what the year 2022 holds in store for the U.S.?

    Gender
    AnswerTotalMaleFemale
    Unweighted N2,6021,3551,247
    More hopeful
    48%
    46%
    50%
    More fearful
    51%
    53%
    49%
    No answer
    2%
    1%
    2%
    Question wording: Looking ahead to next year, are you more hopeful, or more fearful, about what the year 2022 holds in store for the U.S.?
    Survey dates: 
  • How about for the world in general? Are you more hopeful, or more fearful, about what the year 2022 holds in store for the world in general?

    Gender
    AnswerTotalMaleFemale
    Unweighted N2,6021,3551,247
    More hopeful
    44%
    42%
    46%
    More fearful
    54%
    57%
    52%
    No answer
    2%
    1%
    2%
    Question wording: How about for the world in general? Are you more hopeful, or more fearful, about what the year 2022 holds in store for the world in general?
    Survey dates: 
  • Finally, what about the coronavirus pandemic? Are you more hopeful, or more fearful, about what the year 2022 holds in store for the coronavirus pandemic?

    Gender
    AnswerTotalMaleFemale
    Unweighted N2,6021,3551,247
    More hopeful
    61%
    64%
    59%
    More fearful
    37%
    35%
    39%
    No answer
    2%
    2%
    3%
    Question wording: Finally, what about the coronavirus pandemic? Are you more hopeful, or more fearful, about what the year 2022 holds in store for the coronavirus pandemic?
    Survey dates: 
  • Joe Biden?

    Gender
    AnswerTotalMaleFemale
    Unweighted N2,6021,3551,247
    Net positive
    44%
    41%
    47%
    Very good year
    11%
    9%
    12%
    Good year
    34%
    32%
    35%
    Net negative
    53%
    58%
    49%
    Bad year
    22%
    20%
    23%
    Very bad year
    32%
    38%
    26%
    No answer
    3%
    1%
    4%
    Question wording: Joe Biden?
    Survey dates: 
  • The U.S. economy?

    Gender
    AnswerTotalMaleFemale
    Unweighted N2,6021,3551,247
    Net positive
    48%
    46%
    49%
    Very good year
    8%
    9%
    7%
    Good year
    40%
    37%
    42%
    Net negative
    50%
    53%
    47%
    Bad year
    33%
    34%
    32%
    Very bad year
    17%
    19%
    15%
    No answer
    2%
    1%
    3%
    Question wording: The U.S. economy?
    Survey dates: 
  • U.S. politics?

    Gender
    AnswerTotalMaleFemale
    Unweighted N2,6021,3551,247
    Net positive
    38%
    35%
    40%
    Very good year
    6%
    6%
    5%
    Good year
    32%
    29%
    35%
    Net negative
    59%
    62%
    57%
    Bad year
    36%
    36%
    36%
    Very bad year
    23%
    26%
    20%
    No answer
    3%
    2%
    4%
    Question wording: U.S. politics?
    Survey dates: 

Ready to send your own surveys?