
Key Findings:
- Workers of color, opting to leave race at the door, are more likely to identify as American than as members of their racial group in a professional or work setting.
- Race continues to shape experiences significantly for Americans of color across different settings.
- Asian Americans remain hesitant in reporting hate crimes, and one in three (33%) feeling less safe in public spaces compared to the previous year.
- Asian and Black workers perceive a lack of leadership representation and bias at work.
- Employee resources groups continue to be an important source of workplace support for Asian workers, but see room for improvement
- Asian and Black Americans report the largest strides in media representation over the last five years
- Younger Americans are more likely to perceive older generations as barriers to economic leadership opportunities
- Biden sees highest approval ratings from Black and Asian Americans
Workers of color, opting to leave race at the door, are more likely to identify as American than as members of their racial group in a professional or work setting.
Americans of color often switch identities depending on the environment; the majority describe themselves as American when at work or in a professional setting, rather than as a member of their racial group or heritage. Slightly more than half (56%) of Asians and Hispanic or Latino Americans view themselves as American in such settings, slightly outnumbering the half who identify as a member of their racial group or heritage (52% and 50%), while Black or African Americans (67%), American Indians or Alaskan Natives (68%) and Native Hawaiians or Pacific Islanders (59%) are much more likely to identify as an American than their racial group or heritage (41%, 43%, 46%). In settings with friends or family, however, racial and ethnic identify strengthens and shifts away from “American” across all non-white racial groups:
- When with friends, 63% of Asian or Asian Americans view themselves as a member of their race, ethnicity, or heritage, compared with 46% who identify as American. This trend increases with family, with 73% viewing themselves as part of their race or heritage rather than American (35%).
- NHPI Americans also see a similar trend: 66% identify as part of their race, ethnicity, or heritage when with family, compared with 42% who identify as American. With friends, 59% opt to identify with the race or heritage, compared with 45% who self-identify as American.
- Black or African Americans in work or professional settings are also more likely to identify as American (67%) than a part of their race, ethnicity, or heritage (41%) at work, but have similar levels of racial and ethnic identification in settings with friends (43%) and family (46%).
Race continues to shape experiences significantly for Americans of color across all settings, including online and digital spaces
From social media and online spaces, in-person gatherings with friends, their local neighborhood, to workplaces, race continues to be one of the leading aspects that help shape experiences for Americans of color. Even within social media or online spaces where digital identities are typically anonymous or virtual, race is just as relevant as age for Black or African Americans (45% and 47% respectively), and nearly as salient as age for Asian or Asian Americans (42% vs. 47%) and NHPI (38% vs. 55%). Race is less relevant but still important for Hispanic or Latino Americans (34%) and American Indian or Alaska Natives (27%), while only 19% of white Americans say race plays a role in their experience in social media or online platforms.
Race is perhaps is the most pertinent aspect of the identity of Americans of color when it comes to experiences within their local neighborhood: 54% of Black or African Americans say race is most relevant to their experiences in their neighborhood, ahead of age (42%), education (30%), gender identity (16%), or sexual orientation (9%). Race is similarly a leading factor for NHPI, Asian or Asian Americans and Hispanic or Latino Americans: 52% of NHPIs, 49% of Asian or Asian Americans, and 45% of Hispanic or Latino Americans cite race as most relevant to their neighborhood experience, on par or ahead of all other aspects of their identity.
In-person gatherings with friends sees less but still substantial emphasis on race than age across all racial groups: nearly four in ten Asian or Asian Americans (40%) say race plays a role in such settings, on par with Black or African Americans (39%) and NHPIs (36%), and ahead of American Indian or Alaskan Natives (26%) and Hispanics or Latinos (32%).
Race also plays a substantial role in shaping experiences in the workplace, with Asian, NHPI, and Black or African American workers saying that their racial or ethnic background is as relevant, or nearly as relevant as age when it comes to treatment at work. While educational background leads all other aspects (i.e. race, age, gender identity, sexual orientation) in impacting workplace experiences, race and age still have a substantial influence:
- 43% of Black or African American workers say their race is relevant to workplace experiences, higher than 38% who cite age. Black workers are the only racial or ethnic group where race is more relevant than age.
- 38% of Asian or Asian American workers say their race is relevant to how they are treated at work, similar to the 41% who cite their age.
- 38% of NHPI workers say race impacts their treatment at work, on par with 44% who cite age.
- One in three (31%) Hispanic or Latino Americans say race plays a role in their experience at work, lower than those who cite age (42%) or education (54%).
- Only 14% of white workers say their race influences how they are treated at work, on par with gender identity (15%) and far below age (49%) and education (56%).
Americans of color continue to face elevated levels of race-based hate crimes compared to white Americans
American Indians or Alaskan Natives and multi-racial Americans remain most likely among all racial groups to be a victim of a hate crime, with three in ten (29%) reporting that they or their property have experienced physical assault or threats of physical assault. About one in five Blacks (22%), Asians (21%), Hispanics or Latinos (18%), and NHPIs (21%) have ever experienced a hate crime, while incidents of racial hate crimes are much lower among White Americans (14%).
Racial slurs are the most common form of discrimination faced, with one in five (21%) Americans of color reporting being called an ethnic or racial slur, more than twice the number of white Americans (9%) who report a similar experience. Native Hawaiian and Pacific Islanders experience the highest rates of such incidents, with nearly one in three (30%) experiencing being called a racial or ethnic slur. Asian and Black adults also report elevated experiences with racial slurs (both 23%), ahead of Hispanic or Latino adults (17%) and American Indians or Alaskan Natives (15%).
Native Hawaiian or Pacific Islander Americans are especially prone to experience race-based hate crimes at higher rates than other racial groups:
- 15% experienced threats of property damage or destruction, more than double the percentage of non-white (6%) and white (5%) adults
- 12% experienced property damage or destruction, compared to 6% of non-white adults and 5% of white adults
- 14% experienced cyberbullying based on their race or ethnicity, twice the rate of non-white (6%) adults and three times that of white adults (4%)
Asian Americans remain hesitant in reporting hate crimes, with one in three (33%) feeling less safe in public spaces compared to the previous year.
3 years removed from the 2021 Atlanta shootings, Asian and Asian Americans continue to show heightened concern about safety and hate crimes. They continue to be less comfortable than other racial groups in reporting a hate crime with law enforcement authorities, with 31% saying they would be ‘very comfortable’ in reporting a hate crime, compared with 42% of American Indian or Alaskan Natives, 48% of Black or African Americans, 46% of Hispanics or Latinos, 40% of Native Hawaiians or Pacific Islanders, and 52% of white Americans. This level of comfort is on par with previous years (30% in 2021 and 2022, 29% in 2023). Sentiment around law enforcement also sees little to no change compared to prior years.
Four in ten Americans overall are feeling less safe public compared to last year
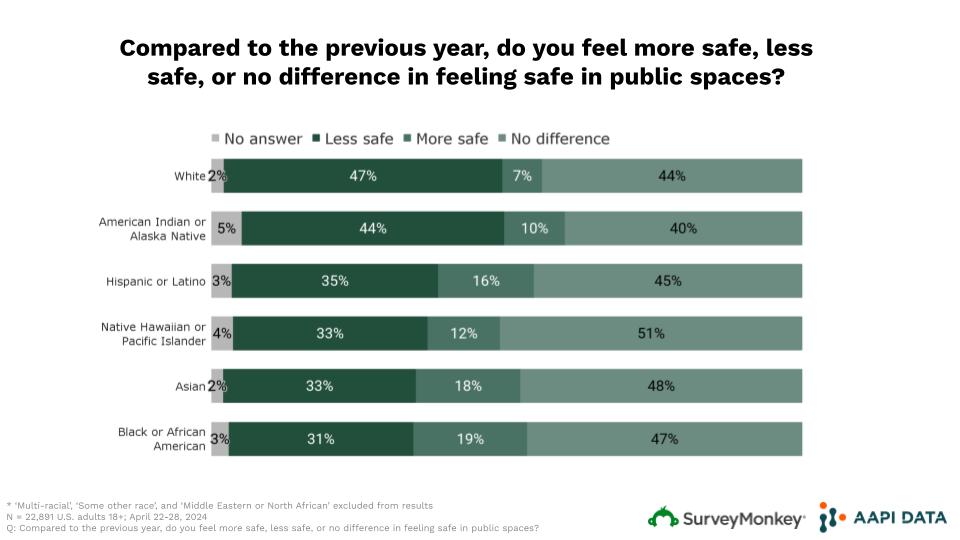
Nearly half of white Americans (47%) and American Indian or Alaska Native Americans (44%) report feeling less safe in public compared to the previous year, ahead of all racial groups, with one in three Asian or Asian American (33%), Black or African American (31%), and Hispanic or Latino (35%) adults also report year-over-year declines in feelings of public safety.
Asian and Black workers perceive a lack of leadership representation and bias at work.
While the majority of workers believe their workplace does ‘just enough’ in addressing representation in leadership positions, bias and cultural sensitivity at work (66%), and discrimination (68%), Asian and Black workers are more likely than workers of other racial groups to say that their workplace is falling behind in addressing these key issues:
- One in four Asian (24%) and Black workers (23%) say their employer is not doing enough to increase diversity and representation in leadership roles, compared to 17% of workers overall, including 18% of American Indian or Alaskan Native workers, 17% of Hispanic workers, 16% of NHPI workers, 14% of white workers.
- Slightly more than one in five American Indian or Alaskan Native (22%), Asian (22%), and Black (24%) workers say their employer does not do enough to address bias and cultural insensitivity in their workplace, higher than the 15% of workers overall who share the same sentiment, including 16% of Hispanic or Latino workers, 13% of NHPI workers, and 13% of white workers.
Asian workers trail other racial groups in consideration and support of leadership opportunities at work
Support for leadership opportunities remains elusive for Asian workers, with only a quarter (24%) who ‘strongly agree’ that they have support to take on leadership opportunities at work, on par with the previous year (26%), and lower than all other racial groups, including American Indian or Alaskan Natives (44%), Black or African Americans (39%), Hispanics or Latino (39%), NHPI (47%), and white workers (41%).
Asian workers are less likely than most other racial groups to ‘strongly agree’ that they have support for leadership opportunities (24% among Asian workers vs. 39% of workers overall), or want to be considered for leadership positions (26% among Asian workers vs. 42% of workers overall). Native Hawaiian and Pacific Islander workers are similarly less likely to seek consideration for leadership opportunities (30% vs.42% overall), but are on par with other racial groups when it comes to receiving support in the workplace (47% vs. 39% overall).
Employee resource groups continue to be an important source of workplace support for Asian workers, but see room for improvement
Nearly one in five Asian or Asian American workers (17%) participate in an employee resource group (ERG) related to their racial or ethnic background, a participation rate higher than that of other racial groups, including Black or African American workers (12%), Hispanic or Latino workers (11%), NHPI workers (14%), and white workers (4%).
Despite high levels of participation in ERGs among Asian workers, only a slight majority of Asian workers (58%) report a positive impact from these groups on their workplace experience, on par with Hispanic or Latino workers (59%). Black or African workers report the highest satisfaction, with two in three (68%) saying ERGs have had a positive experience on their experiences at work, highlighting an opportunity for organizations to model other ERGs after those focused on black employees.
Asian and Black Americans report the largest strides in media representation over the last five years
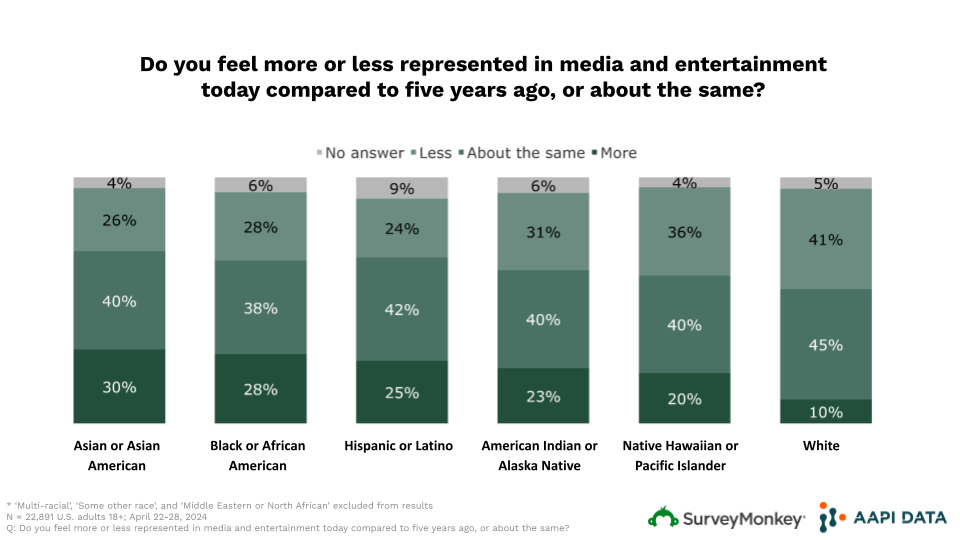
Three in ten Asian (30%) and Black Americans (28%) say they feel more represented in media and entertainment today than they did five years ago, underscoring recent initiatives to diversity cultural representation within media. However, this sentiment of increased representation is not felt equally across all racial and ethnic groups: 25% of Hispanic or Latino Americans, 23% of American Indian or Alaskan Natives, 20% of Native Hawaiian or Pacific Islanders report feeling more represented now compared to five years ago.
Younger Americans are more likely to perceive older generations as barriers to economic leadership opportunities
Despite a general sentiment where twice as many Americans believe older generations help rather than hinder access to economic and leadership opportunities (47% vs. 24%), younger demographics tend to view them has obstacles.
- Among Asian or Asian American Gen Zers, about one in three (35%) believe older generations impede access to opportunities, compared with 29% of Asian Millennials, 24% of Asian Gen Xers, and 12% of Asian Boomers or those in the silent generation.
- 34% of Black or African American Gen Zers view older generations as an obstacle, compared to one in five Black Millennials (23%) and Gen Xers (20%).
- A similar proportion (34%) of Hispanic and Latino GenZers share the same sentiment, compared to 23% of Hispanic Millennials and 19% of Hispanic Gen Xers.
- White Gen Zers and Millennials are notably skeptical of older age groups, with half (50%) of white Gen Zers and one in three (36%) White Millennials viewing older generations as an obstacle to opportunities.
Nonetheless, a significant percentage of Gen Zers of color also think they receive support from older generations, especially. An equal number of Asian, Black, and Hispanic Gen Zers believe that older generations either hinder or help facilitate access to opportunities.
- 39% of Asian Gen Zers think older generations help provide access to economic and leadership opportunities, on par with the 35% who think they do more to limit access.
- 36% of Black Gen Zers believe older generations do more to provide access, compared with 34% who think they limit access.
- 33% of Hispanic Gen Zers believe older generations do more to help provide opportunities, compared with 34% who think they limit access.
- White Gen Zers are nearly twice as likely to say that older generations limit access (50%) than help provide access (27%) to opportunities for younger generations.
Biden sees highest approval ratings from Black and Asian Americans
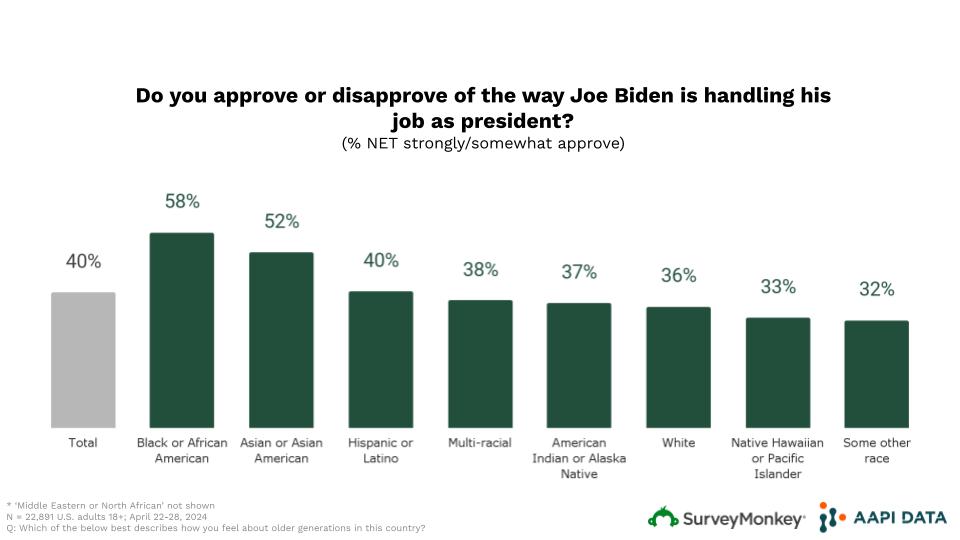
Less than half (40%) of all Americans ‘strongly’ or ‘somewhat’ approve of Biden’s performance in office so far. Approval is lowest among NHPI (33%), white (36%), American Indian or Native American (37%), and Hispanic or Latino (40%) Americans, and highest among Asian (52%) and Black (58%) adults.
We asked about race and ethnicity four different ways: here’s what we found
“White” has historically been the default category for those who identify as Middle Eastern or North African within the U.S. census. Statistical Policy Directive No. 15, also known as SPD 15, is a set of recommended revisions to the U.S. Census on how to most accurately ask about race and ethnicity to accommodate an increasingly diverse population, most notably especially for those of Middle Eastern or North African descent. We asked four different variations of race and ethnicity to understand how Americans identify when presented with “Middle Eastern or North African”, a “Some other race” write-in option, and detailed examples for each racial group.
| What is your race or ethnicity? (Select all that apply) | ||||
| Version 1A - include “Middle Eastern or North African” - exclude “Some other race” open end - exclude race/ethnicity suggestions in answer options | Version 1B - include “Middle Eastern or North African” - exclude “Some other race” open end - include race/ethnicity suggestions in answer options | pp. Δ | ||
| Unweighted N | 5815 | Unweighted N | 5836 | |
| White | 64% | White (e.g. German, Irish, English, Italian, Polish, French, etc.) | 65% | +1pp |
| Hispanic or Latino | 19% | Hispanic or Latino (e.g. Mexican or Mexican American, Puerto Rican, Cuban, Salvadoran, Dominican, Colombian, etc.) | 19% | 0pp |
| Black or African American | 13% | Black or African American (e.g. African American, Jamaican, Haitian, Nigerian, Ethiopian, Somali, etc.) | 13% | +1pp |
| Asian | 7% | Asian (e.g. Chinese, Filipino, Asian Indian, Vietnamese, Korean, Japanese, etc.) | 7% | 0pp |
| American Indian or Alaska Native | 4% | American Indian or Alaska Native (e.g. Navajo Nation, Blackfeet Tribe, Mayan, Aztec, Native Village of Barrow Inupiat Tr | 3% | 0pp |
| Middle Eastern or North African | 1% | Middle Eastern or North African (e.g. Lebanese, Iranian, Egyptian, Syrian, Moroccan, Israeli, etc.) | 1% | +1pp |
| Native Hawaiian or Pacific Islander | 1% | Native Hawaiian or Pacific Islander (e.g. Native Hawaiian, Samoan, Chamorro, Tongan, Fijian, Marshallese, etc.) | 1% | 0pp |
| Version 2A - exclude “Middle Eastern or North African” - include “Some other race” open end - include example groups | Version 2B - exclude “Middle Eastern or North African” - include “Some other race” open end - include example groups | pp. Δ | ||
| Unweighted N | 5735 | Unweighted N | 5505 | |
| White | 63% | White (e.g. German, Irish, English, Italian, Polish, French, etc.) | 61% | -1pp |
| Hispanic or Latino | 18% | Hispanic or Latino (e.g. Mexican or Mexican American, Puerto Rican, Cuban, Salvadoran, Dominican, Colombian, etc.) | 19% | +1pp |
| Black or African American | 13% | Black or African American (e.g. African American, Jamaican, Haitian, Nigerian, Ethiopian, Somali, etc.) | 13% | 0pp |
| Asian | 7% | Asian (e.g. Chinese, Filipino, Asian Indian, Vietnamese, Korean, Japanese, etc.) | 7% | +1pp |
| American Indian or Alaska Native | 3% | American Indian or Alaska Native (e.g. Navajo Nation, Blackfeet Tribe, Mayan, Aztec, Native Village of Barrow Inupiat Tr | 3% | 0pp |
| Native Hawaiian or Pacific Islander | 1% | Native Hawaiian or Pacific Islander (e.g. Native Hawaiian, Samoan, Chamorro, Tongan, Fijian, Marshallese, etc.) | 1% | 0pp |
| Some other race (please specify) | 3% | Some other race (please specify) | 4% | 0pp |
| No differences were detected to be significant at the 95% confidence level | ||||
- Middle Eastern and North African only made up 1% of respondents, on par with an estimation by the U.S. Census.
- Nearly half (53%) of respondents who initially identified as Middle Eastern or Northern African ended up identifying as multi-racial (12%), white (18%), or some other race (11%).
- “White” remains a common identification for respondents who select “Some other race”. While 1% of respondents identified primarily as Middle Eastern or North African overall, only 3% of respondents who selected “Some other race” primarily identified as Middle Eastern or North African compared to 20% who primarily identified as “White”. Among those who selected “Some other race”:
- 53% primarily identified as “Some other race”
- 20% identified as white
- 16% identified as multi-racial
- 3% identified as Black or African American
- 2% identified as Hispanic or Latino
- 3% identified as Middle Eastern or North African
- 2% identified as Asian
- 1% identified as American Indian or Alaska Native
- Inclusion of example groups had no statistically significant impact on how respondents identified.
Read more about our polling methodology here.
Click through all the results in the interactive toplines below: