It’s a no brainer that we love research. We yearn for the who, what, when, where and why behind all things. That’s why, when it comes to collecting demographic information on a survey, we’re big fans!
The details of the population that you’re surveying helps you understand more about what makes your respondents tick, especially if they’re your customers.
Whether you’re testing a new product, measuring patient satisfaction, or studying prospective college students, the data has little value if you don’t understand your audience.
Market research you can get done today
Looking for a fast and easy market research solution? Meet our global consumer panel SurveyMonkey Audience.
With SurveyMonkey, we make it easy for you to collect and analyze that demographic data. So let’s get to it, shall we?
Getting to know your respondents
SurveyMonkey offers you 3 super easy ways to get a better understanding of who your customers are:
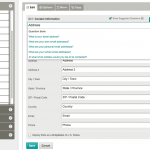
1. Ask: With our Multiple Choice, Dropdown, and Textbox question types, you can create customized demographic questions that allow you to ask for details like gender, age, and profession. When using the Contact Information question type, you’re able to choose how much information you’d like to acquire. Don’t need their phone number or email address? No problem—simply uncheck that box and it won’t be included!

2. Use SurveyMonkey Audience: Want to ask 18-year-old students if they’re planning on attending college so you can market your university accordingly? Or maybe ask folks from a variety of income levels about their spending habits, but don’t know how to reach them? Have no fear! SurveyMonkey Audience has got you covered.
You can create an Audience collector from your account and select your respondents by choosing from 30+ attributes to help you target your respondents. The demographic information you specify will automatically be included in the results. No extra work necessary.
3. Templates: We’ve taken even more steps to try to help make your life even easier. Take your pick from a number of demographic survey templates created by our survey scientists. With these templates you can collect firmographics, customer demographics, education demographics (just to name a few) in a flash.
Dive into your data
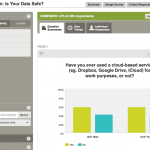
For example, say you want to see how your latest ad campaign performed with women versus men. Just apply a Compare rule and choose “women” and “men” in your demographic question to see responses side by side:

Now let’s say you want to only see the men and women who are in the 30-44 age group. You can drill down into your data even more by selecting Filter by Question and Answer and selecting the age question while the Compare rule is applied.
Related reading: Enhance your marketing with geographic segmentation insights
Create reports and share your insights
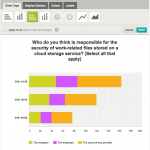
You’ve now filtered your data and created some beautiful side-by-side comparisons. So you’ll want to share it with your colleagues, right? With your rules applied, you can create swanky custom charts, reports, and share links that can be readily emailed or presented in your next meeting.

Applying the Compare and Filter rules together, or separately, is the perfect way to see how your research is performing against particular audiences. Now that you’re an ace at gathering and analyzing demographics, you’re all set to give your respondents what they want—and even exceed their expectations!
Got any tips on collecting great demographics? Or have any questions for our survey experts? Let us know!


