

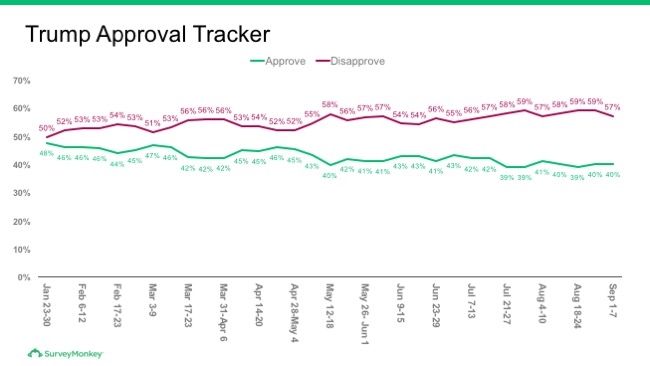
President Donald Trump’s overall job rating stands at 40 percent approve, 57 percent disapprove in SurveyMonkey tracking for the week from September 1 through September 7.
The massive scale of SurveyMonkey’s tracking – we typically interview over ten thousand adults per week – enables us to assess Trump’s approval rating across all fifty states when we roll up data over time.
Specifically, between June 1 and August 31, SurveyMonkey’s tracking yields 163,671 interviews among adults nationwide, which breaks out to 500 interviews or better in 46 states and the District of Columbia, plus at least 300 interviews in the four least populated states (Vermont, Rhode Island, North Dakota and Wyoming).
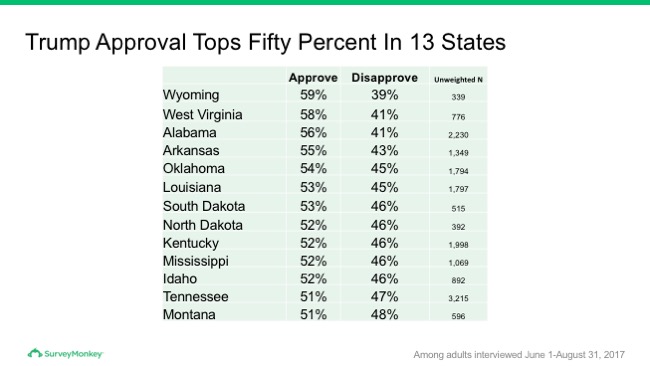
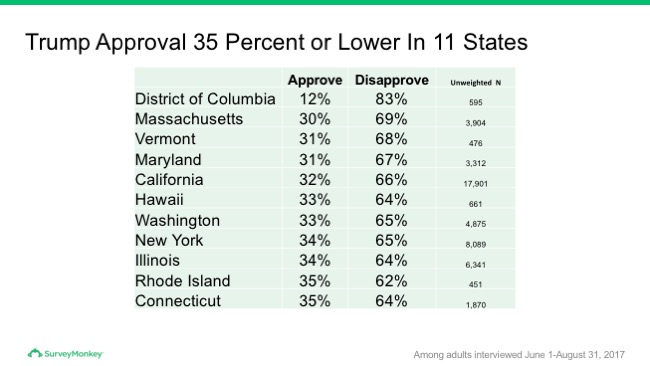
The results show Trump’s approval rating varying between a high of 59 percent approval in Wyoming to a low of 12 percent approval in the District of Columbia, in data collected over the past three months.
Trump’s approval tops 50 percent in just 13 states. These states are, not coincidentally, those which Trump won by the widest margins in 2016: Wyoming, West Virginia, Alabama, Arkansas, Oklahoma, Louisiana, South Dakota, North Dakota, Kentucky, Mississippi, Idaho and Tennessee.
Trump’s approval is 35 percent or lower in 11 states – Connecticut, Rhode Island, Illinois, New York, Washington, Hawaii, California, Maryland, Vermont, Massachusetts – plus the District of Columbia. Not surprisingly, these are states where Hillary Clinton prevailed by widest margins in 2016.
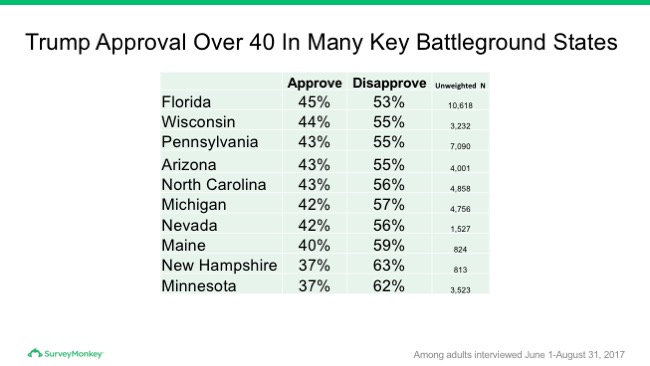
Also as expected, Trump’s ratings in the key electoral battlegrounds fall somewhere in the middle. His approval percentage varies between 42 and 45 percent in Florida, Michigan, Pennsylvania and Wisconsin, four states that tipped the election and favored Trump over Clinton by less than 1 percent of the votes cast. Those numbers are slightly better than Trump’s 41 percent national approval rating in SurveyMonkey’s tracking over the same three month period.
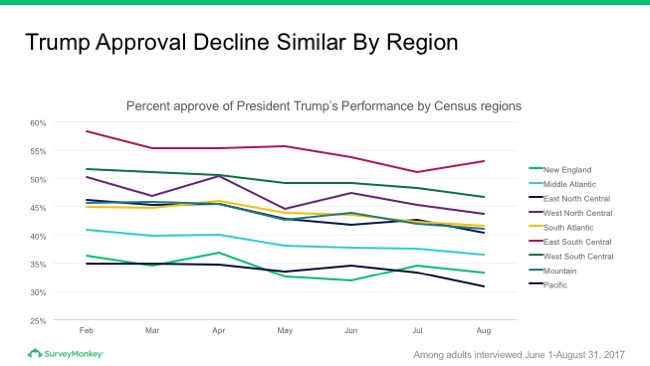
Analysis of these results over time is difficult given the relatively small sample sizes for some individual states. However, combining states into regions shows that the gradual decline in President Trump’s ratings over the past six months has been very similar across the United States. Trumps ratings are highest in the South, lowest in New England, Middle Atlantic and Pacific states, but his numbers have been slowly declining in parallel everywhere.
Full results for all individual states can be viewed here.
This Week
Nationwide, Trump’s approval percentage (40 percent) was unchanged, while his disapproval number ticked down (from 59 to 57 percent) over the past week. Trump’s approval rating has held mostly steady, varying between 39 and 41 percent over the past five weeks.
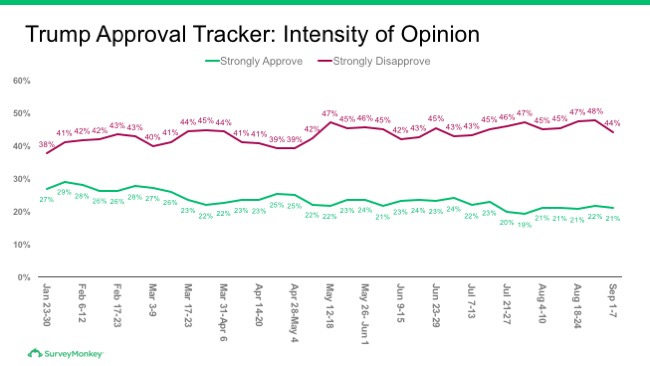
Strong disapproval of Trump dropped to 44 percent after hitting a new high of 48 percent the previous week. Nevertheless, the gap between strong disapproval and strong approval remains better than two-to-one.
This week’s full approval topline results and a detailed demographic breakdown can be viewed here.
Results from previous weeks can be accessed here.
Methodology: This SurveyMonkey Tracking poll was conducted online September 1 through September 7, 2017 among a national sample of 13,443 adults ages 18 and up. Respondents for this survey were selected from the nearly 3 million people who take surveys on the SurveyMonkey platform each day. Data for this week have been weighted for age, race, sex, education, and geography using the Census Bureau’s American Community Survey to reflect the demographic composition of the United States. The modeled error estimate for this survey is plus or minus 1.5 percentage points.


