Some people say you shouldn’t compare yourself to others. At SurveyMonkey, we beg to differ.
Often the only way to find out whether you’re doing a good job is to see how you compare to others like you, or industry standards—especially when it comes to intangible subjects like customer satisfaction, employee engagement, or event feedback.
If you send an event feedback survey to your attendees and they say the event was “very valuable,” it may make you feel good, but it doesn’t tell you much specifically.
However, if you know that people usually find similar events to be only “somewhat valuable,” then that’s something you can work with---and feel great about.
By knowing the benchmark of how people regard conferences like yours in general and comparing it to how they regard your own, you can take action: set goals, make improvements, and measure your own performance.
That’s where SurveyMonkey Benchmarks comes in. It lets you see your results in context so that you know how you compare to your industry, region, or organization type.
By anonymizing, aggregating, and sorting the millions of survey responses SurveyMonkey receives from organizations like yours, Benchmarks allows you to see where you really stand.
Curious? You can check out Benchmarks for free
If you’re curious about how the product works, it’s possible for you to see some of our free benchmarks without paying a dime—or even running a survey.
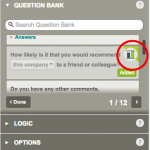
Using Question Bank, design a survey using questions that are benchmarkable—you’ll know because they have the benchmark symbol next to them.

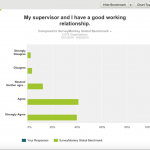
Instead of sending the survey out to respondents, immediately go to the Analyze Results section to see the free benchmarks on that subject—no survey responses needed!
While it may be interesting to look at, it probably won’t be very useful until you can compare it to your own results. Seeing benchmark data about employee satisfaction, for example, isn't meaningful unless you know where your own organization fits in.

Notice how there aren't any responses to compare the benchmarks to? Have your respondents take your survey to see how you compare.
Furthermore, our free benchmarks will only compare your data to all the organizations in our data set. If you’re interested in fine-tuning your benchmarks data to see how your organization stacks up compared to others in your industry, region, company size, and more, you should consider buying benchmarks data.
See All of Our Available Benchmarks
Compare yourself across different industries, sectors, company sizes, and more.
Learn More
Feel free to use and edit our templates
It’s easy to pick and choose individual questions from our Question Bank, which is full of questions that are created and certified by our survey experts to avoid bias and yield data that’s comparable on Benchmarks.
Even better, we’ve got an entire template of questions to meet your survey needs. These templates are created by our experts and have questions that complement one another to provide with a fuller view of your subject of interest.
Want to get feedback on your website? We’ve got a benchmarkable template for that. Want to see how satisfied your customers? We’ve got one for that too.
It’s best to start with these templates and add or subtract questions as needed. If a question seems irrelevant, delete it. If you want to ask something else, add a question. It won’t affect the quality of your benchmarks data.
But avoid editing individual questions
While you should feel free to add and delete questions from a template at will, editing benchmarkable questions is another matter.
Benchmarks is all about standardization. In order to achieve accuracy when comparing questions from one organization to the next, the questions should all be exactly the same.
That’s why we have our survey experts create them to avoid bias, and also why it’s best not to edit the wording of individual questions in the template.
While you might want to change the wording of one of your questions to be a little more specific, doing so means SurveyMonkey can no longer guarantee that your benchmarks comparisons are valid.
Your respondents may be biased by your changes and interpret those questions differently than people who saw the original question, potentially giving you a mistaken impression of where you stack up.
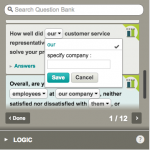
Some Question Bank questions allow you to customize them by using drop-down menus in the question text.

If you edit the question response or the question type of any benchmarkable question, SurveyMonkey Analyze will remove benchmarks for that question.
Export your data for a closer look
If you’re a data nerd or a survey pro who wants to really drill down into the data, we’ve got you covered. If you purchased Benchmarks, you can export a CSV of the raw benchmark data by clicking clicking the black down arrow to the right of the benchmark in the left sidebar and click Download CSV.


