A lot of companies think of Net Promoter Score (NPS®) as a report card. A low score equals a bad grade or a “needs to improve.” A high score means you must be doing all the right things to encourage customer loyalty.
But that’s not always the whole story. NPS has become the gold standard for customer experience, based on one simple question: How likely are you to recommend a company or product? But while this straightforward approach cuts directly to the heart of customer satisfaction, it generally leaves out the “why” behind a consumer’s rating.
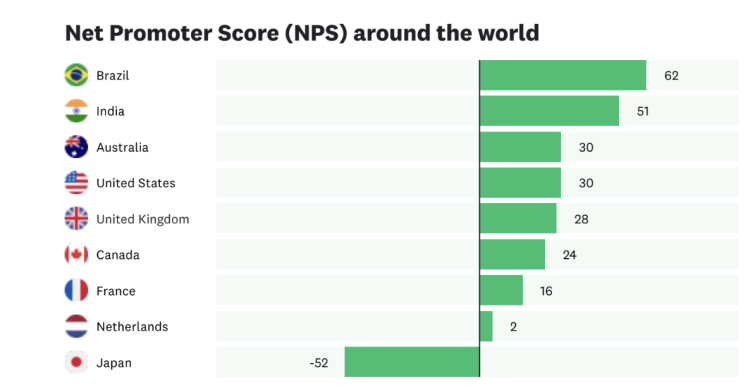
In addition, when an NPS survey is sent in countries outside the US, the results are uneven. In a recent study of almost 5,000 consumers from 9 different countries, we found that NPS scores varied by 100 points; from very low negative numbers to scores at the top of the scale.
It would have been easy to assume that there were lots of dissatisfied customers in countries where NPS scores were low. But we dug a little deeper into consumer sentiment and hypothesized that there were other factors at play. A single question, especially one that might not translate accurately into other languages or mesh with cultural norms, may not indicate the same negative ranking as it does in the US.
In our study, we went beyond that single NPS question and asked consumers what drove their customer satisfaction score. Was it product quality? Personalization? Innovation? By going beyond the standard NPS question, we uncovered contextual data about what consumers value, and how recommending a company or product might carry different significance in different countries.
Japan and Brazil: a study in contrasts
Japan and Brazil ended up on opposite ends of the spectrum for NPS and in other portions of our study. Brazil had the highest NPS of any country; its score of 62 would be considered high by any standard in almost any industry.

Japan had what would be considered a very low NPS—its score of -52 would be a disastrous rating, no matter the industry. What this score represents, however, is up for interpretation.
We found that other studies had uncovered similar results. Some researchers have hypothesized that the whole idea of making a recommendation would be culturally unacceptable in Japan; a country where consumers would consider giving personal advice a somewhat risky venture that might backfire. If this is the case, companies might need to frame the idea of customer satisfaction with a different question to get to the heart of loyalty.
Responses to other questions we asked Japanese consumers supported this thinking. For example, 41% of Japanese consumers say a brand never deserves the lowest score of zero. The tendency to not give the lowest score is more than 2x the global average of 20%. Compared to India—the country with the second highest NPS in our study—Japanese consumers are almost 3x less likely to say a company never deserves the lowest score. This finding seemed contradictory, and challenged the assumption that a country with an NPS of -52 would be more inclined to give a company the lowest score.
In Brazil, the country with the highest NPS, consumers are the most likely to follow a brand on social media, with 3 out of 4 consumers saying they follow companies on social media. In addition, 66% of consumers in Brazil say they provide feedback or reviews about products and services they purchase. India, a country with similarly high NPS, also reports high levels of social sharing and interactions.
For consumers in Brazil and India, sharing feedback and recommendations seems to be a common practice, and widely acceptable. This compares to Japan where only 18% of consumers follow a brand on social, and 12% provide feedback.
English-speaking countries have some similar habits
Bolstering the hypothesis that much can get lost in translation, our study revealed that the UK, US, Australia, Canada all have very similar NPS ratings, ranging from 24 to 30. In fact, the US and Australia have identical scores, with the UK trailing by 2 points.
Consumers in these countries report other similarities, such as social media habits. In Australia and the US, 32% of consumers say they follow a brand on social media. Consumers in Australia (34%), and the UK and US (33%) are almost equally as likely to share feedback with a brand and write an online review. They are also similarly inclined to post negative feedback, averaging around 53%.
Collecting feedback on what drives customer satisfaction
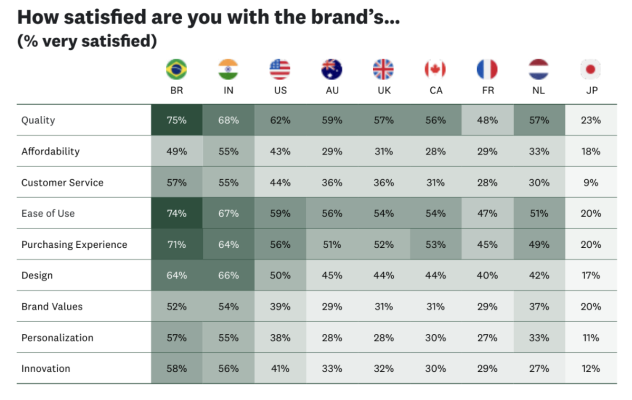
In order to understand the “why” behind our global NPS results, we used key driver analysis (KDA)—a technique that pinpoints what factors have the most influence in driving outcomes. Our survey went beyond the NPS question and asked consumers to rank the importance of 9 different attributes, or drivers, that might impact their satisfaction.

Quality is a leading driver of NPS in the nine countries we surveyed. In fact, it was the top driver in the US, Canada, Brazil, and the Netherlands, and among the top 4 drivers in the UK, France, Australia, Japan, and India.
Affordability was surprisingly in the middle for consumers in most countries, well behind ease of use, the purchasing experience, and design.
Innovation was the top driver for Japan and ranked as the second most important attribute in the UK. Brand values, which barely registered for most countries, came in fourth in the Netherlands—a country with the second lowest NPS.
What’s to be learned from these key drivers? It all depends on where you plan to expand. The bottom line is that in addition to understanding revenue targets and market potential, it’s critical to know what drives customer satisfaction in a given country. Consumers in each country are impacted by social and cultural factors, as well as individual experiences, and it pays to know your audience.
NPS is an important measure for customer satisfaction and loyalty. However, limiting your insights to a single question and a score is just that—limiting. Instead, use your NPS study to understand more about consumers in a new market or even your existing customers in established markets. By asking what they care about, you can take action that will ultimately deliver a better customer experience—and more successful growth and expansion.
Discover more about NPS around the world in the full report. If you’re ready to get started, learn more about launching your own NPS study, plus how to include customer research in your next survey.
NPS, Net Promoter & Net Promoter Score are registered trademarks of Satmetrix Systems, Inc., Bain & Company and Fred Reichheld.


