You’ve written your questions. You’ve configured your survey logic. You’ve even had your colleagues take a spin through to make sure everything is working just right. You’re about to launch your survey, but maybe you’re wondering, “Is today the best day to send it?”
Well, wonder no more. We looked across 100,000 surveys to figure out the impact on response rates if you send your survey out on Monday vs. Friday (or any other day of the week).
The Data
Before we share what we learned, we thought we’d share a bit about the data. Yes, we care a lot about data!
- Time Period: We looked at individual respondents who received survey invitations from our email collector. We excluded the first week of January, the last week of November, and the last two weeks of December to normalize for US holidays.
- Days of the Week: The majority of survey invitations are sent out during weekdays, peaking between 5AM and 4PM PST, so we only included responses to survey invitations that were sent out Monday through Friday from 5AM to 4PM PST. Survey volume during other days and time periods was too low to draw any statistically significant conclusions.
- Survey Topics: Surveys with different topics and intended audiences may have different response rates or optimal send days. We focused our analysis on two of the most popular survey types conducted on SurveyMonkey: customer surveys (surveys of customer feedback or satisfaction) and internal surveys (surveys of employees within an organization), to make sure our analysis would ultimately be useful for you.
- Response Counts: To avoid having any one survey with thousands, or millions, of responses skew the results, we limited our analysis to surveys that collected between 50 and 500 responses. We also only included responses to surveys created from paid SurveyMonkey accounts since free accounts can only have up to 100 viewable responses per survey.
For each day of week, Monday through Friday, we selected a random sample of 20,000 individual respondents who received a survey invitation by email, between 5AM and 4PM PST. We did this for both customer surveys and internal surveys. Within each group, we looked at how many people actually responded, and then calculated Absolute Response Rate (number of people who responded divided by 20,000) for each day.
Our goal was to compare response rates between different days of the week. This was done by showing the response rate by day relative to the average response rate of all days. So for example, if the average response rate of all days was 10%, and Thursday has an Absolute Response Rate of 12%, we get a Relative Response Rate for Thursday of: (12%-10%)/10% = 20%. In other words, surveys sent out on Thursdays received 20% more responses than average.
What did we learn?
Customer surveys
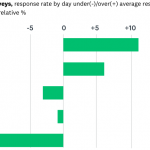
Response rates were highest for survey invitations sent out on Monday, and lowest for invitations sent on Friday.* On average, surveys sent out on Mondays received 10%** more responses than average, and surveys sent out on Fridays received 13%** fewer responses than average.

* Response rates on Monday and Friday are statistically different from average response rate at 0.01 significance level.
** 10% and 13% are relative measures. The absolute response rate does not change by 10% or 13%. For example, a 10% average response rate with a 10% increase would be 11%, not 20%.
Internal surveys
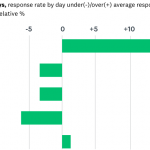
Response rates were significantly higher for invitations sent on Mondays versus those sent between Tuesday and Friday.*** Surveys sent on Mondays collected 13% more responses than the average.

*** Response rate on Monday is statistically different from average response rate and response rates on other days at 0.01 significance level.
What does this mean for you?
Next time you send out a customer or employee survey, you can use this analysis to help you decide what day of the week to send out your survey to get the most responses. You can always test this yourself by sending a portion of your survey invitations out each day of the week to see if response rates differs.


